Sales Reports
The Credit Register lets you choose to include credits lines that have negative quantities, or all lines on a Type C order, or a combination of those definitions.
Because a pricing adjustment is entered as a credit plus a debit, defining a credit as any line on a Type C order shows the net credit or the difference between the "wrong" price and the "right" price.
On the second screen you have the following options in regards to which lines to include on the report:
- Option 1 - to show any debit on a type C invoice, regardless of the credit code field.
- Option 2 - to include only lines that have a credit code. A credit code appears as the result of price adjustments.
This report tracks actual billing and costs against estimated billing and costs. It does this by comparing order dollar amounts against invoiced dollar amounts for the same order or time span.
- Enter any combination of invoice dates, invoice numbers, order dates, and order numbers. You can use the dates and ranges in any combination. However, the defaults of last month's sales & orders taken are the most applicable.
- Use the I/O fields to include or omit parameters. If you include parameters, the report only includes information for the selections you enter. If you omit parameters, the report runs for all parameters except those you enter.
- Enter at least two and up to four sort selections, by entering a 1, 2, 3, and 4 next to your choices. To control where the page break occurs, enter a sort level in the Page Break on Sort Level field. If you don't want a page break enter 1, which will only page break on the 1st level which can be company number.
The report includes totals for all regular line items on the orders. This includes, but is not limited to, material, labor, freight, use taxes, etc. Anything that is placed as a line item on the order is reflected on the report.
This is the main sales tax report, usually run at the end of a month or period, for reporting how much tax was charged.
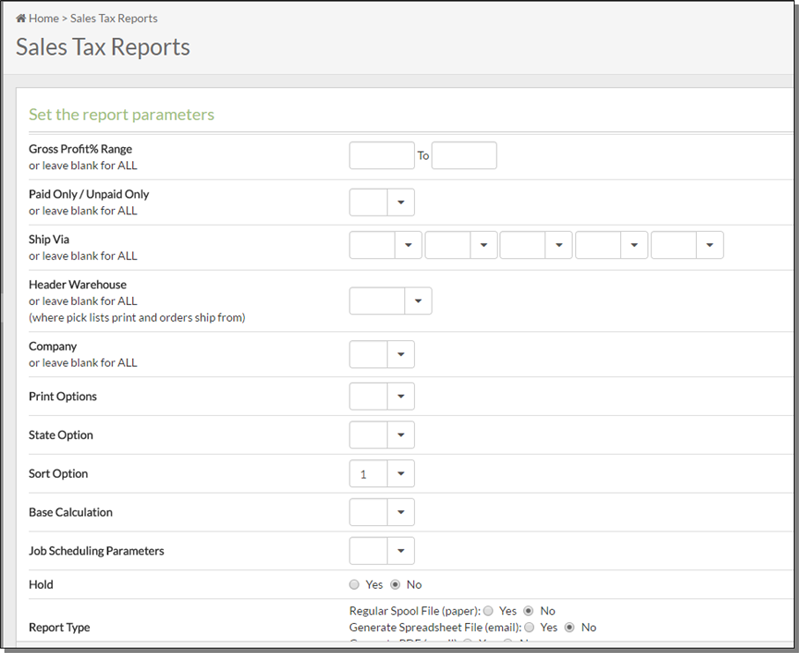
- Enter a Gross Profit % Range to narrow the report down to a specific gross profit margin.
- Enter "P" for Paid Only, "U" for Unpaid Only, or Blank for All - Allows you to include only paid transactions, only unpaid transactions, or both.
- You can use Ship Via codes as one of the parameters to sort and organize this report. This is useful for retail businesses that use special ship via codes for installs versus non-installs. It can also be used to separate "will call" versus other ship via methods. This option can also be important if taxes are applied differently based on ship via codes, such as WILL CALL versus DELIVERY versus INSTALL.
- Use the State Option to choose whether to run the report for the state on the billto or the shipto address. When the Sales Tax Report is formatted and sorted, it uses either the state within the billto address or the state within the shipto address. When an invoice does not contain a shipto address, the billto address is assumed as the shipto address.
- Choose a Sort Option that best serves you. For example Option5 to use the county from the zip table is recommended for any companies that have set up FIL 43 (Tax by Zip Code Table). It sorts by state/county/tax codes. The use of this tax report sort enables you to use the same tax codes for multiple counties, yet still break out taxes and sales by county. For example, tax code A1 could indicate Alabama 10% and can apply to multiple counties. The report can still break on county even through multiple counties are assigned A1.
- For Base Calculations:
- Use Option 1 - Base Calculations on Tax Rates in Current File if you want to run the tax report using the current tax rate in the Tax file.
- Use Option 2 - Base Calculations on Tax Rates applied at time of Invoice if you want to run the tax report to see the amount that was collected at the time of invoicing (tax rate could have changed since then) for tax audits. When you choose option 2, the tax amounts are shown, but not the tax rate, as the rate could vary within a single sub-total, if the rate was changed during the date span of the report.
- Report Type:
- Regular Spool File - generates a regular report that gets sent to your spool file where you can print it out as needed. If you choose this option, none of the other fields are required.
- Generate Spreadsheet - generates a file in a spreadsheet friendly format. You can then choose to print it or email it.
- Generate PDF - generates a file in a spreadsheet friendly format. You can then choose to print it or email it.
- File Name - Enter the file name.
- Destination Folder - This is the IFS directory where you want the report to be placed. Once the spreadsheet or PDF is generated and sent to this destination you can retrieve it via the Windows Explorer, if you are mapped to the folder. It can also be accessed via WRKLNK command on the IBM iSeries. You cannot use directory /QDLS. If you do not enter a destination folder, you must enter an email address. If no destination folder is entered, a temporary one is created that is automatically deleted when the email is sent.
- EMAIL File to - Enter the email addresses of the person or people you want to receive the report.
- You do not have to assign a directory if you email only, the system will automatically use /home/Kerridge/reports/temp
- A Java Kit must be installed on your server (automatically installed via the IBM V5R3 Upgrade).
- The HTTP Server, TOMCAT and APACHE servers must be running.
- If you use the ODS system these servers will already be running.
The following guidelines pertain to the email feature:
This report is similar to the main sales tax report. This report has additional features for auditing.
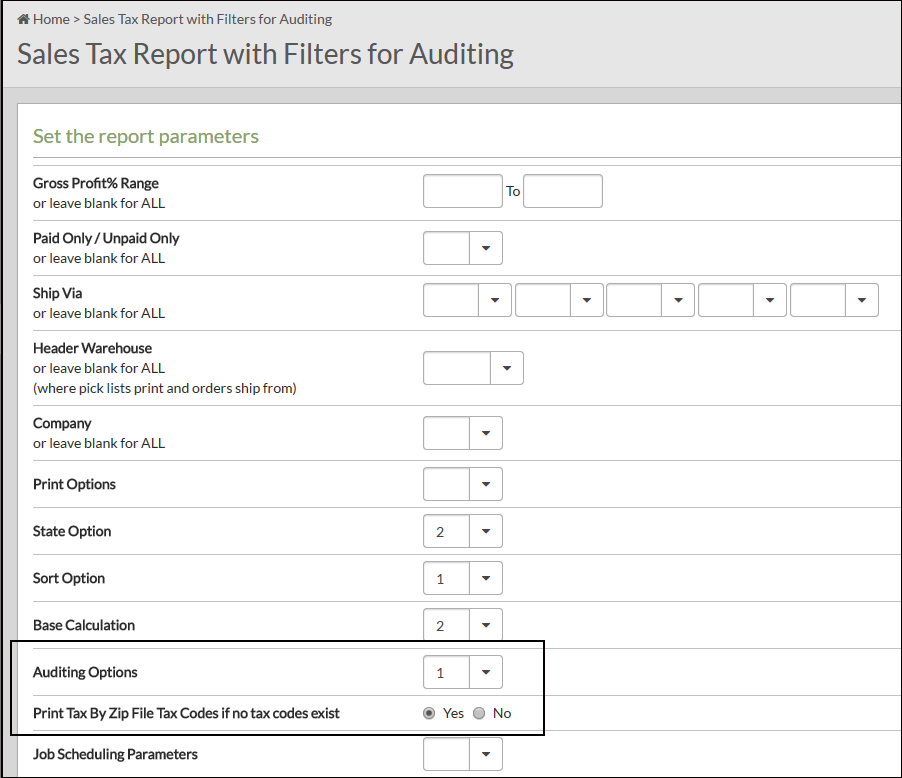
Auditing Options:
- Include all invoices (taxed or not)
- Only include invoices with no tax codes
- Only include invoices with tax codes, but with a zero rate
- Only include invoices with no tax codes OR a zero rate
If an invoice does not contain any tax codes, activate the setting Print Tax By Zip File Tax Codes if no tax codes exist to use the tax codes in the Tax by Zip Code Table (FIL 43).
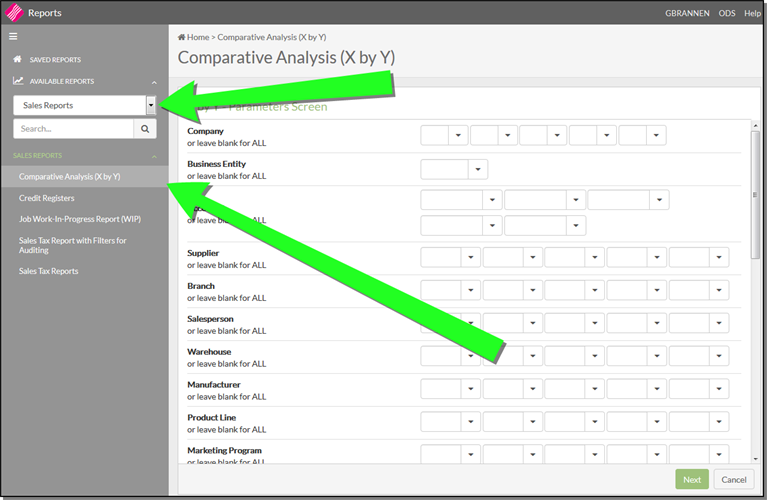
- Access the Comparative Analysis (X by Y) from the Sales Report section.
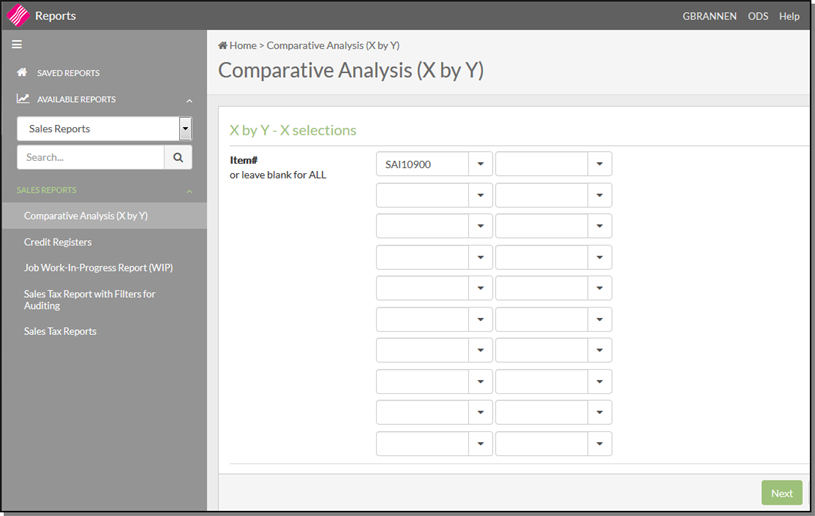
- Select the parameters to include in the report and click Next to select the X parameter.
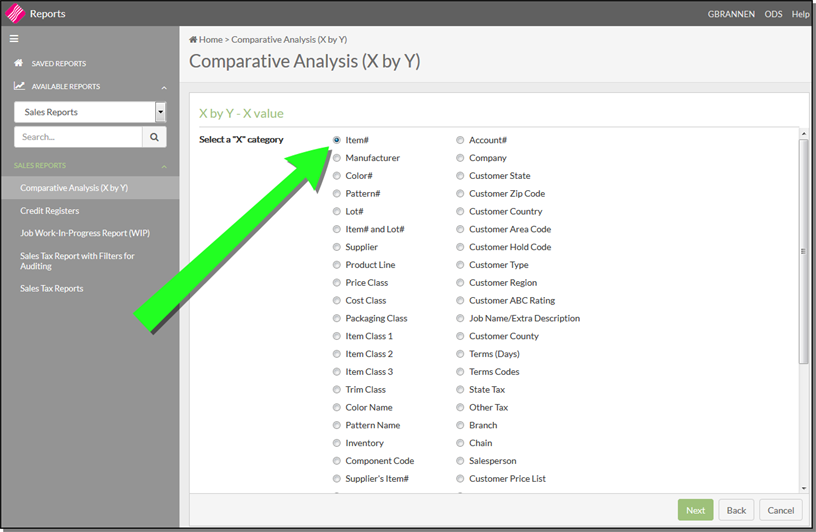
- Click Next to enter the X parameter; which in this example is an Item.
- Go through the same steps for selecting the Y parameter.
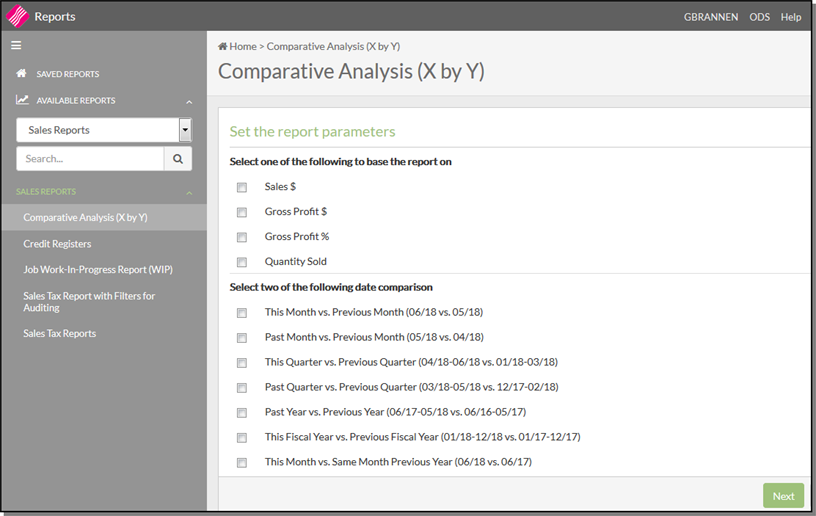
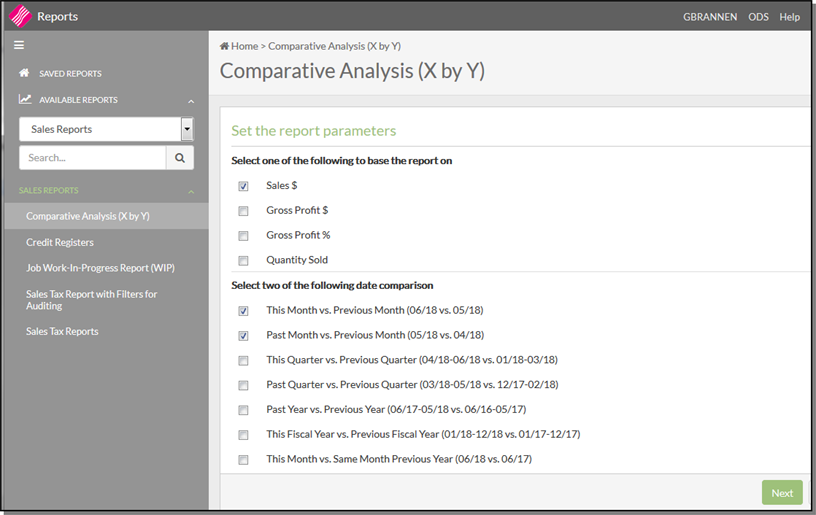
- After selecting the Y parameter, you are asked what you want to compare and the comparison time frame.
- Make your selections and click Next.
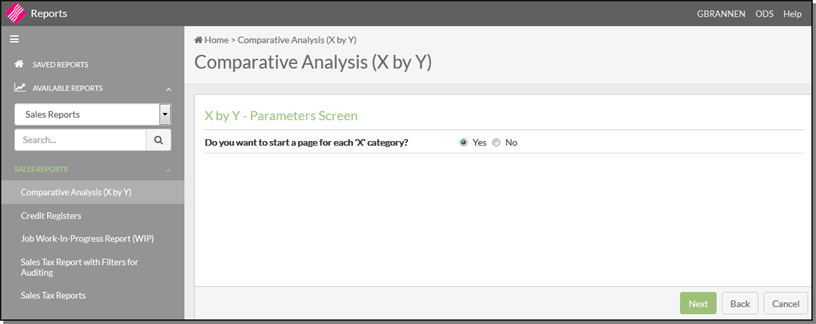
- The next window gives you control over where page breaks occur in the report.
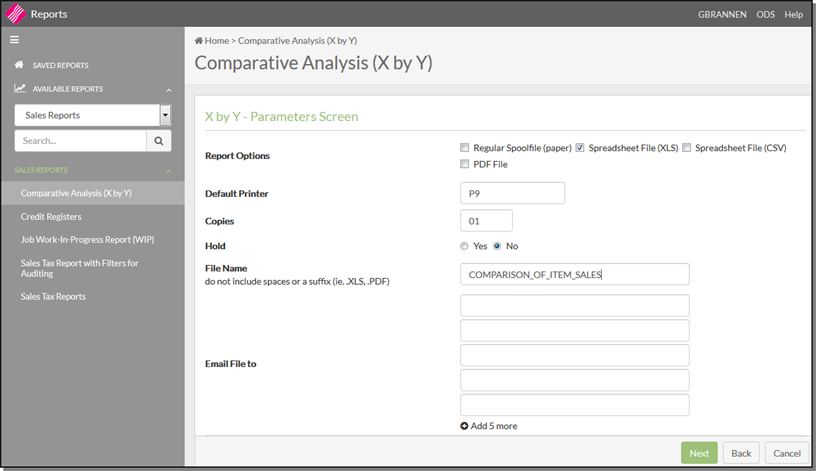
- The next window provides distribution options for the report.
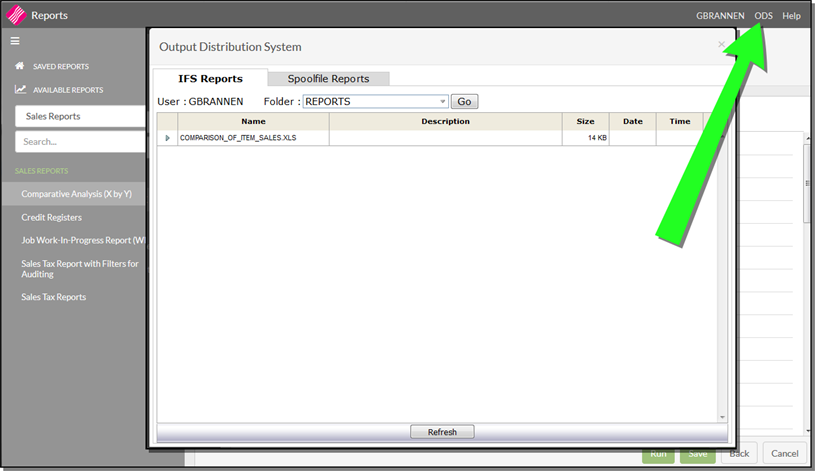
- After the report is generated, it can be accessed via the ODS heading under IFS Reports.
This report enables you use the X by Y functionality for reporting Gross Profit.
Gross profit analysis is designed to pick apart the reasons why the gross profit margin changes from period to period, so that management can take steps to bring the gross margin in line with expectations.
Access the Gross Profit Analysis for Orders (X by Y) from the Sales Report section.
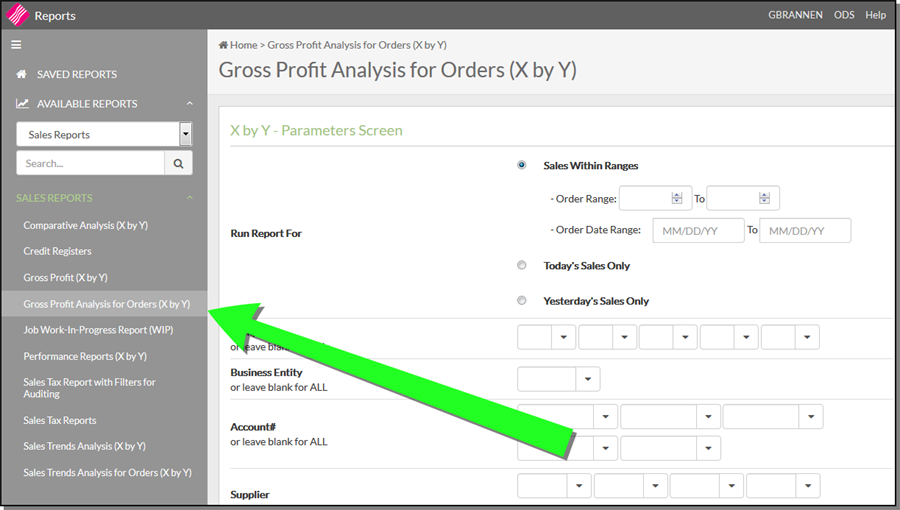
Select the parameters to include in the report and click Next to select the X parameter.
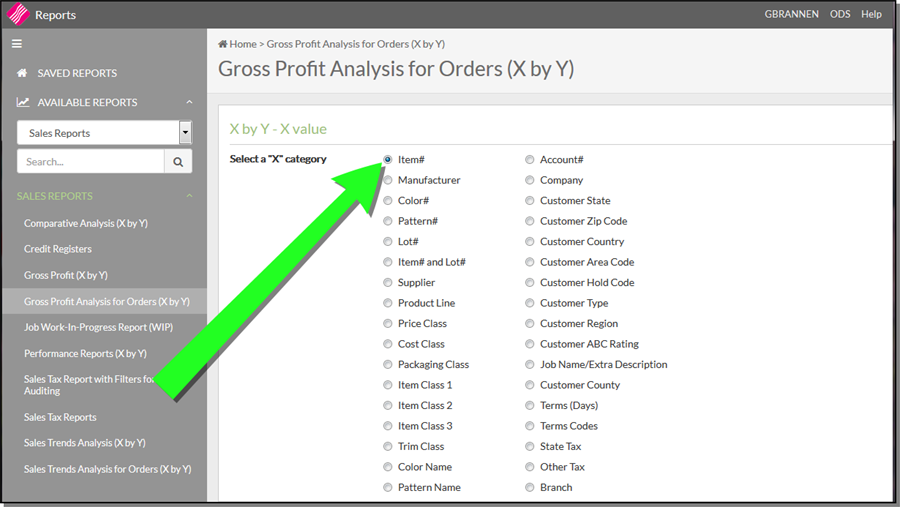
Click Next to enter the X parameter; which in this example is an Item.
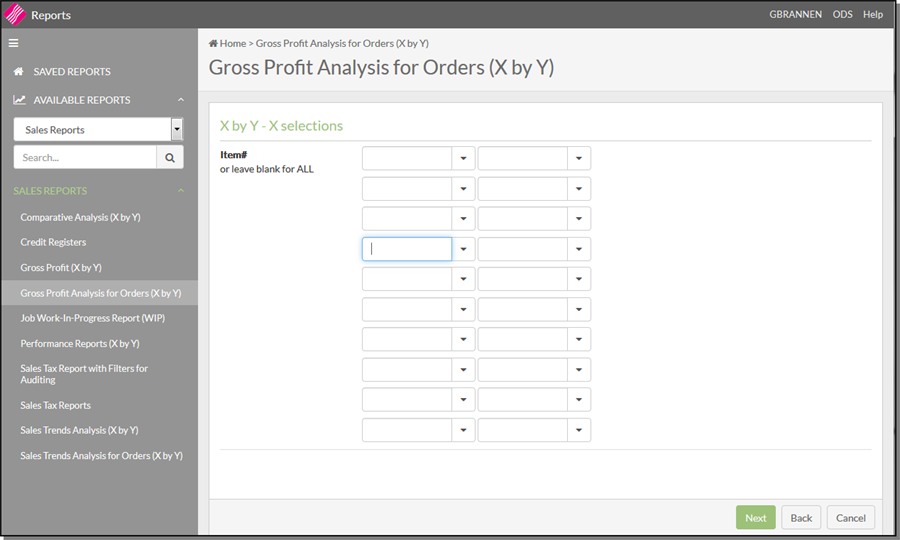
Go through the same steps for selecting the Y parameter.
After selecting the Y parameter, you are presented with more report parameters.
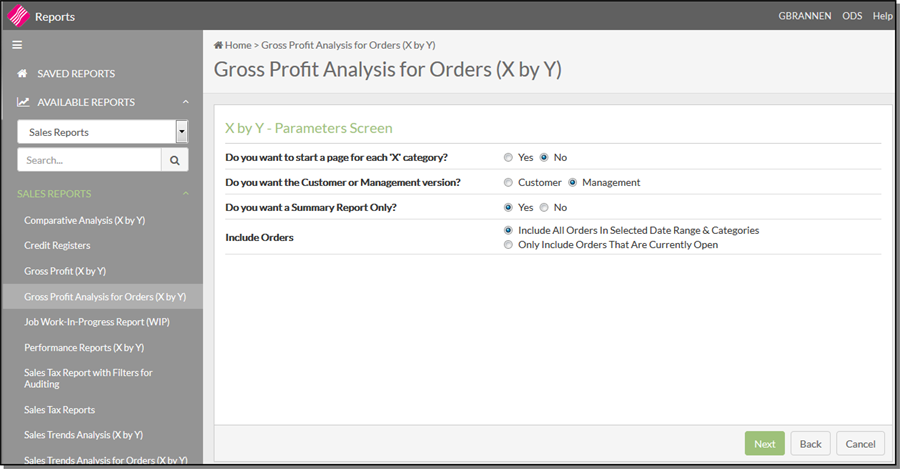
- Do you want the Customer or Management version? - The Management version can contain sensitive cost/profit and performance information that you might not want some users to obtain. Access to the management version of the report can be granted or denied via the settings Allow Costs To Show On Orders and Cost on the User ID Control panel (SET 2).
- Do you want a Summary Report Only? - The summary version presents a clear and concise view of the information. The detailed version expands each entry to provide more information
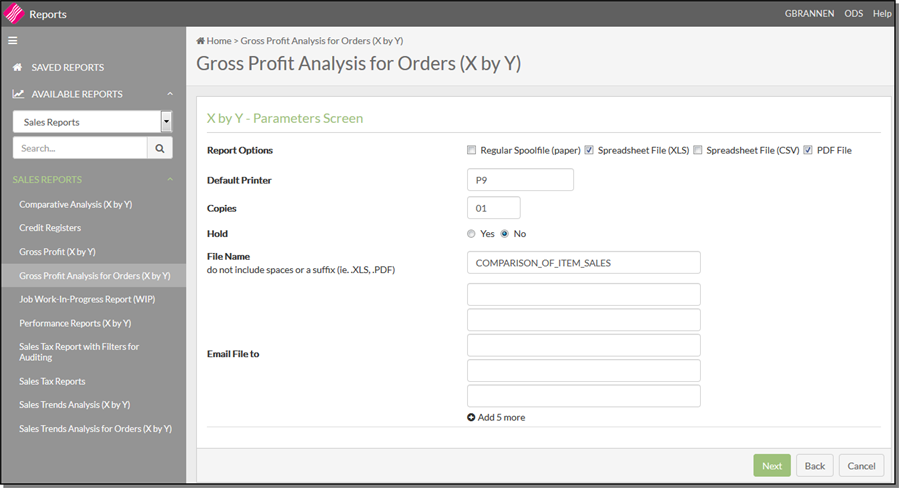
Click Next. The next window provides distribution options for the report.
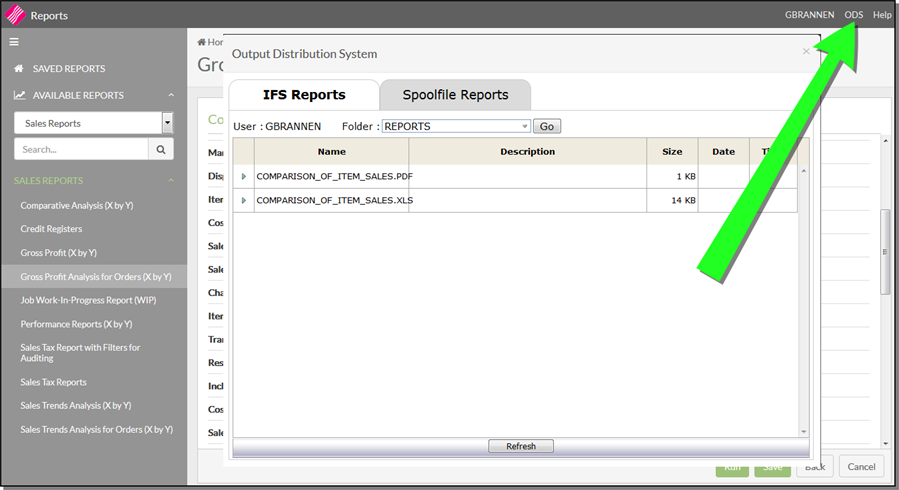
After the report is generated, it can be accessed via the ODS heading under IFS Reports.
Sales trend analysis is the review of historical revenue results to detect patterns. Sales trend analysis is a useful budgeting and financial analysis method that can indicate the onset of changes in the near-term revenue growth rates of a business.
This option produces a ranking report based on one of the following: Gross Sales, Gross Profit $, Gross Profit %, and Quantity Sold.
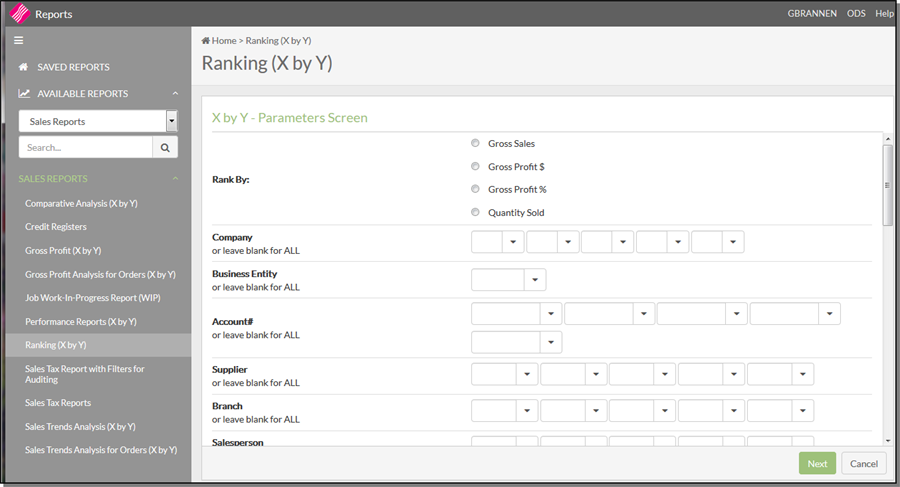
Work through the windows to select the X and Y parameters.
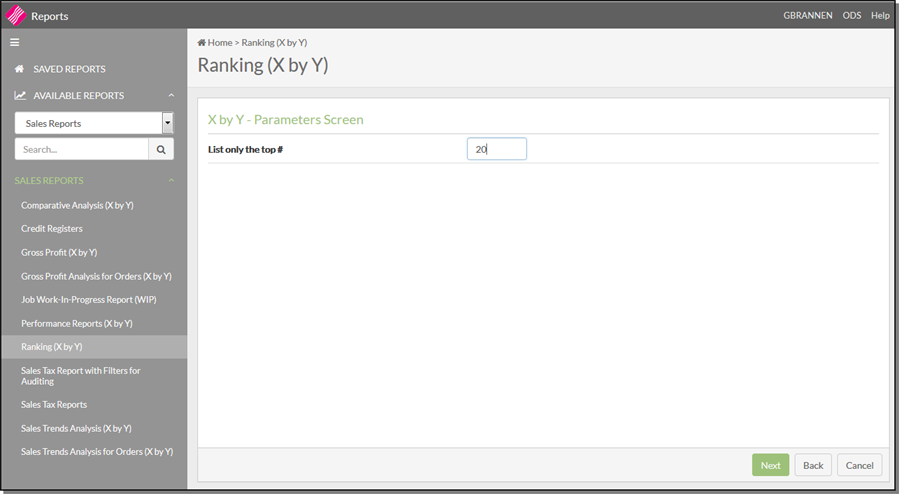
The following window allows you to limit the records displayed to the number you want to see. For example, if you only want to see the top 20 selling items enter a 20 in this setting.
This report is useful in performing comparative analysis over a 24 month period.
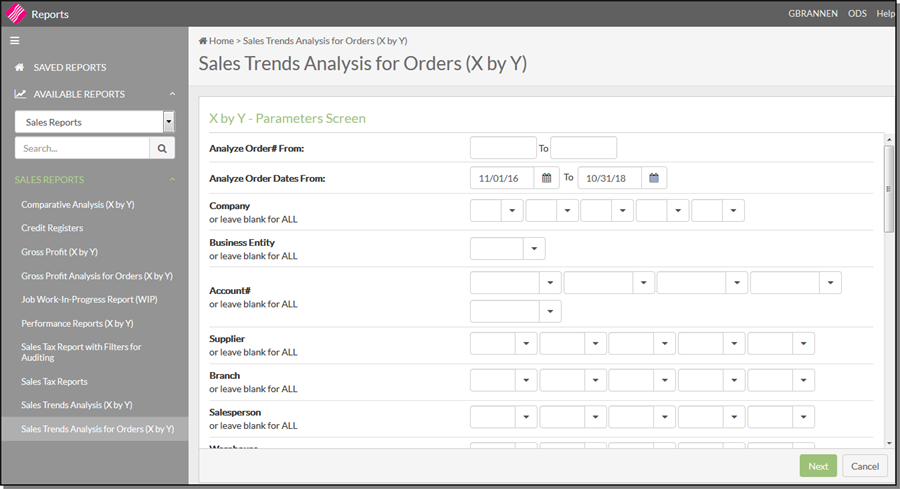
The first window is the main Parameter selection window. Enter an order or date range. Select the rest of the parameters to include in the report i.e., companies, cost centers, accounts, etc.
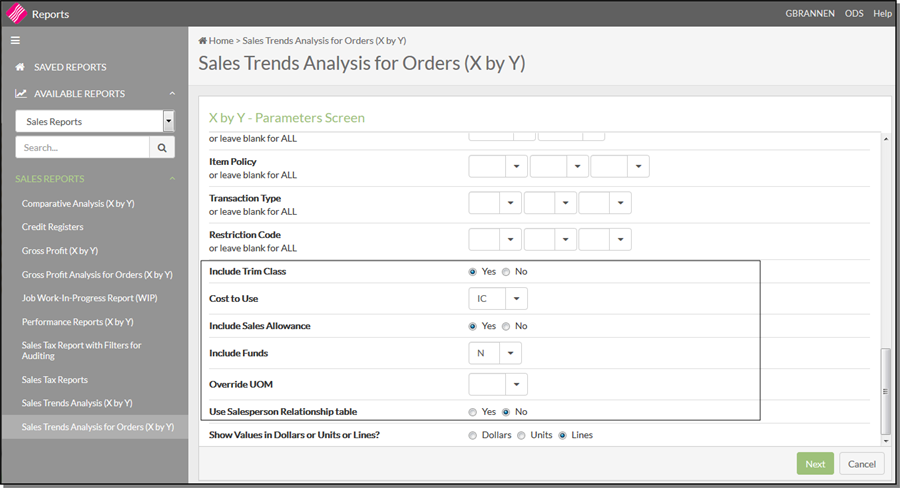
Near the bottom of the window, are the additional following parameters:
-
Include Trim Class - Enter N to omit sales of items that have a trim class in the Item File.
-
Cost to Use
-
IC - the default, uses the actual cost on each invoice/line.
-
SC - Standard Costs from the Cost or Item Files instead of the invoice costs.
-
HC - House Cost from the Cost File instead if the invoice costs.
-
-
Include Sales Allowance - Enter Y to include the sales allowance (promo) portion of the price. Enter N to remove the sales allowance from the price. Y is the default.
-
Include Funds - Enter Y to include the fund/overbill portion of the price. N is the default.
-
Override UOM - If you enter a unit of measure, the report uses it instead of the UOM designated in the item file.
-
Use Salesperson Relationship table - The Salesperson Relationships table links multiple salesperson numbers together for the purpose of secure access to information.
The report includes information from the various Master Files in the X and Y Description columns.

Scroll to the right to see additional information about the items on the report.

Running the Report by Line
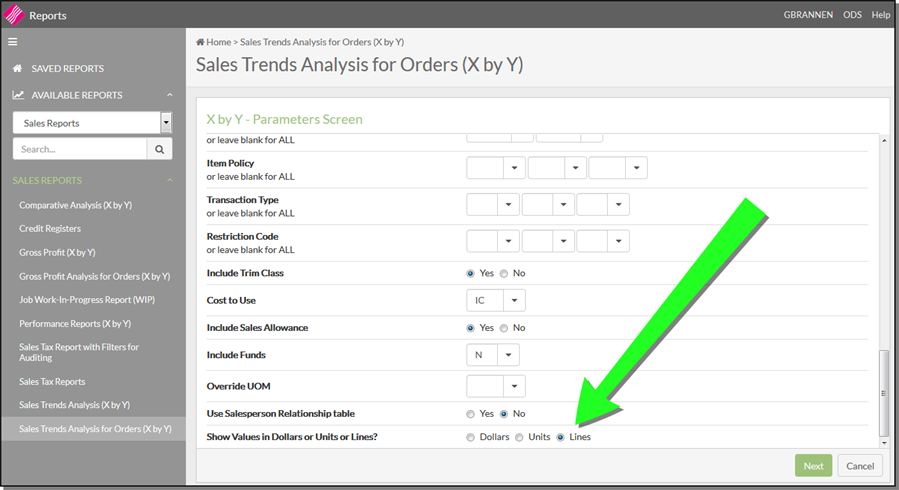
One version of the X by Y Sales Trend Analysis Report (for regular or credits only version) can list the number of lines rather than dollars or units. The number of lines relates to line items within invoices. This option is especially useful for the following customized reports:
- Number of lines by credit type within branch, manufacturer, and so on. This report shows how many occurrences there are of each type of credit, including pricing errors, shipping errors, or claims.
- Number of lines by truck route within warehouse indicating the picking and loading activity level.
- Number of lines by price list number indicating how often different price lists are used.
- Number of lines by restriction code for counting cuts, rolls, and so forth.
- Number of lines by operator initials, salesperson, or work station ID indicating productivity levels.
In order to use the this feature, select the Lines option in the Show Values in Dollars, Units, or Lines setting at the bottom of the first window of parameters.
These reports enable you to compare sales. gross profit dollars, gross profit percentages, or quantity sold for two different time frames and for any of the X by Y categories. The report lists the sales (or GP$, GP% or Qty sold depending upon your selection) for each time frame being compared. It also lists the change (difference) in dollars (or quantity) as a percent of the earlier date span.
The following date comparison options are available:
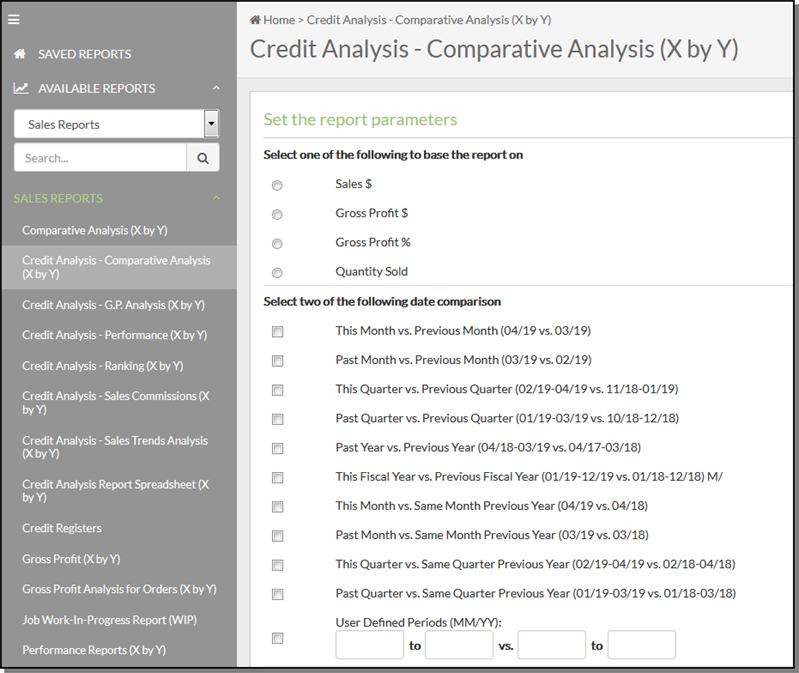
This Month - current month (month you are currently in)
Past Month - the month before the current month
This Quarter - current month plus the two months before the current month
Past Quarter - three months before the current month
The term Previous always relates to the period to which it compared to. For example Previous month mean the month before the current one.
This report gives your company a powerful tool for tracking the success and failures of your marketing, your products, and your customer base. The performance reports rank the change in sales, gross profit dollars, gross profit percentage, or quantity sold between any two time frames. For example, you can sort customers from largest sales increase down to the largest decrease in sales. The report allows you to enter the date spans or you pick from a list of options. You can base the report on change in sales, gross profit dollars, profit percentage or quantity sold.
You can rank (sort) the report by:
- Change in Quantity Sold
- % Change in Quantity Sold
- Sales $ Past Month
- Sales $ Previous Month
- Gross Profit $ Past Month
- Gross Profit $ Previous Month
- Gross Profit % Past Month
- Gross Profit % Previous Month
These reports are similar to the other X by Y reports, except that they only include credits. They extract credits if the entire invoice was a credit memo, or even if a credit line was imbedded in an overall debt invoice. You can sort or include by credit code or by any of the X by Y options.
The following Credit Analysis reports are available:
- Credit Analysis Sales Trend Analysis - See by your parameter selection (i.e. manufacturer or supplier) whether credits are on the rise or fall.
- Credit Analysis G. P .Analysis - Allows you to see details of each credit for Sales Within Ranges, Today's Sales Only or Yesterday's Sales Only.
- Credit Analysis Ranking - To see the customers with the most credit for each credit type.
- Credit Analysis Sales Commissions - Allows you to isolate the effect on commissions.
- Credit Analysis Comparative Analysis - Allows you to measure dollar and percentage increase/decrease in credits by choosing between several time frames.
- Credit Analysis Performance - Allows you to track the success and failures of your marketing, your products, and your customer base based on credit type.
