Inventory Reports - Menu RIV
Print Audit Trail For An Item - RIV 1
Item Stock Locations List - RIV 2
Inventory Value and Aging Reports - RIV 3
Print Inventory Registers - RIV 6
Print Negative Inventory List - RIV 8
Special and Discontinued Items List - RIV 9
Item Reorder and Inventory Forecast Reports - RIV 10
Item Cost Variance Report - RIV 11
Print Turn, Earn, & GMROI Analysis Reports - RIV 12
Print Inventory Spreadsheets - RIV 13
Print Serial Number Listings - RIV 101
Serial Number Inventory Tags - RIV 102
List of Temporary Inventory Holds - RIV 103
Inventory Reconciliation Report - RIV 105
Product Line Forecast Report - RIV 106
Special Lists Option - RIV 107
Inventory Reports (Sales and Receipts) - RIV 108
Print Inventory Reorder Exception Reports - RIV 109
Print Product By Warehouse By Month Spreadsheets - RIV 110
Serial Number Summary Reports - RIV 111
Free Locations Report - RIV 112
List of Serialized Inventory Without Bin Locations Report - RIV 113
Item Sales, Price, & Cost Analysis Report - RIV 114
Serial# Listing for Rolled Goods (RIV 116)
Print Inventory Adjustments Analysis Reports (RIV 117)
Inventory Stock Out Predictor Report (RIV 118)
Inventory Receipts Status Report - RPT 510
Print Audit Trail For An Item - RIV 1
The Audit Trail Report is used to analyze data for a particular item. You can request to print from a certain date span or month span. You can request an audit trail for all or specific companies, branches, cost centers, job transaction codes, account types, account numbers, journal numbers, batch numbers, source codes, workstation IDs and many combinations thereof.
If you are a registered user of IWMS and are licensed to use 8-character locations, both the 8-character and the 4-character locations show on an item's Audit Trail. Eight character locations, used in the IWMS, provide more flexibility in establishing warehouse location schemes.
Item Stock Locations List - RIV 2
This option lets you customize and run a report showing inventory locations. A series of screens lets you customize the report by:
- listing - there are seven listing options that range from Warehouse/Item to Warehouse/MFGR/Pattern Name/Item Number/Location.
- report version - There are four available report versions.
- Regular - lists item#, name, locations, qty onhand, qty allocated, qty scheduled, last receipt date, & last cycle count date
- Expanded - includes all the information of the regular version, but also lists the open orders & purchase orders that could affect your actual onhand qty, such as transfers, orders now being invoiced or with status S, or POs with status R or P.
- Complete - includes ALL open orders and purchase orders with their status.
- Complete version without purchase orders. - similar to the complete version, except it does not show the open purchase orders for each item. The report still shows all open orders with their correct status.
- parameter selection - This screen lets you tell the system exactly which parameters to run the report for. You can limit it by up to 23 parameters (manufacturer, price class, color name, etc.) or you can run it for all parameters on your system by leaving the fields blank.
- warehouse or company selection.
- location - You can specify up to four locations or enter ALL to include all of them.
- omitting records if there is no inventory.
- unit of measure selection.
Inventory Value and Aging Reports - RIV 3
These reports are based on the last receipt date for each product at each warehouse. This is the recommended report to analyze how current the items you have in stock are. Since it is based on the last receipt date, older unsold serial numbers of a recently purchased item are considered as new as the last receipt. The item, including all of its serial numbers, is considered as new or as aged, as its last receipt. This version is recommended when showing inventory aging to your bank.
Stock Status Report - RIV 4
This report tells you how much inventory you have, and where it is, for all your warehouses and item numbers or just one.
One version of the report, the Stock Activity 18 Month Spreadsheet, includes the following information about each item or item/warehouse record:
- 18 monthly totals of receipts, shipments, and number of orders placed.
- Open orders shown in total, and within each of the months that they were placed. Open orders older than 18 months are shown within the earliest column.
- Turns and GMROI based upon the past 12 months.
- Stock Onhand and Stock Available. Stock Available does not consider back orders. It is the current stock available.
- Scheduled on purchase orders.
- Future Available = scheduled less back orders. This is similar to the F stock card view on Inventory Inquiry.
Other Parts of the System that effect the Stock Status Report
- SKU File - Stock Status Reports use the SKU File Stock/NonStk flag if found. If an SKU File Stock/Nonstk flag is not found, the system uses the Item File Inventory flag. The SKU File is accessed via option 13 on the File Maintenance menu. The field that controls the override is circled in the figure below.
- An entry of Y (stock) or N (non stock) in the Stock/Non-Stock Override Field overrides the Item File Inventory Flag. Leave this SKU file field blank if the Item File inventory flag applies to all warehouses. Use this field only when one or more warehouses deviate from the overall status of the item. For example, if you stock and item in all but one warehouse, the Item File Inventory Flag should be set to Y, and the SKU File Flag set to N in the one warehouse. Other warehouse SKU entries should be left blank.
- Item File - The Item File record for the same item is shown below. The Inventory field controls whether the item is stock, non -stock, or special order. In this example the item is stock (Y).
Stock Activity Reports RIV 5
You can run a summary report that includes item number, item description, quantity onhand, stock allocated, current stock available, scheduled, back orders, future available, quantity shipped, and number invoices.
The Stock Activity Summary with Stock Status combines sales figures with a breakdown of current versus future inventory availability, resulting in a very clear and simple inventory analysis report.
The Stock Activity Report, summary version for a specified date span, shows unit cost and value shipped as a tool for reporting on consignment stock. You can choose to express the shipped value using last cost, average cost, or base cost. By using base cost, you can report to your supplier without the affect of freight cost. This is important if the supplier did not cover the freight costs.
- The Stock Activity Report is recommended for reporting on the status of consigned inventories to applicable suppliers. To facilitate this feature sort the report by the supplier's item number. This provides more effective consignment inventory reporting to your suppliers.
- The Stock Activity Spreadsheet includes the following information about each item or item/warehouse record:
- 18 monthly totals of receipts, shipments, and number of orders placed.
- Open orders shown in total, and within each of the months that they were placed. Open orders older than 18 months are shown within the earliest column.
- Turns and GMROI based upon the past 12 months.
- Stock Onhand and Stock Available. Stock Available does not consider back orders. It is the current stock available.
- Scheduled on purchase orders.
- Future Available = scheduled less back orders. This is similar to the F stock card view on Inventory Inquiry.
Option 3 - to sort Stock Activity by Supplier Item of the report facilitates more effective consignment inventory reporting to your suppliers.
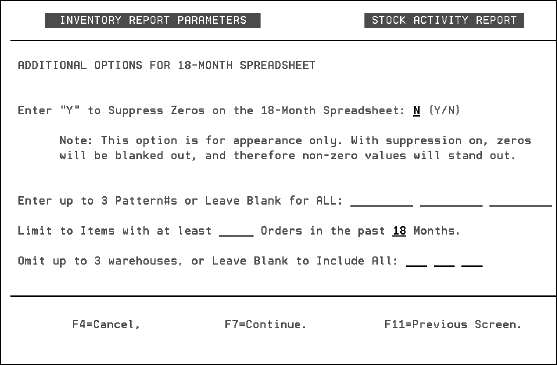
This screen only appears when you are working with the 18-month spreadsheet.
The Stock Activity never shows crossover items (since they have no inventory).
- Enter Y to Suppress Zeros on the 18-Month Spreadsheet - Use this option to drop zeros from the report and make it easier to read. This report includes a lot of information on each page, and you may find it easier to see the meaningful figures if the zeros are not shown.
- Enter up to 3 Pattern#s or Leave Blank for ALL - Pattern numbers are characters 8-16 of an item number.
- Limit to Items with at least____ Orders in the past___ Months - Allows you to target faster moving inventory and eliminate clutter on the report by not showing slow moving inventory.
- Omit up to 3 warehouses, or Leave Blank to Include All- This option is only shown if the option to include all warehouses (or all warehouses within a company) was selected.
- Use the I/O ABC Codes or Leave Blank to Include All field to limit the report to specific ABC codes.
- Use the I/O COST CENTERS or Leave Blank to Include All field to limit the report to specific cost centers.
- The field Enter 1 to OMIT Discontinued Items, 2 for ONLY Disc, or 3 for All allows you to include or exclude discounted items.
- To print the most landed current cost, activate the field Print Last Cost, and to print the current list price activate the Print List Price field.
- Use the field For rolled goods, break out available qty as follows: > vs <= than to identify rolled goods inventory that is either over/equal to or under a specified amount.
Print Inventory Registers - RIV 6
This option lets you print registers for the following transactions:
- Receipts - There is an Extended Receipts Register (198 columns). This option is applicable only if you utilize the extended receiving fields. The extended version lists a complete cost breakdown, and also shows the new other Reference Number field. You can also run an Intercompany Receipts version. This report allows for a detailed reconciliation to the GL for receipts considered to be intercompany. This is recommended for companies that have multiple divisions that supply material to each other.
- Adjustments - Inventory adjustment registers can be run for specific areas and bin locations, and the detail version can be sorted by location. You can analyze adjustment activity and location change activity for specific locations. These features are applicable for analysis of overstock areas, slow moving stock areas, sample rooms, and manufacturing process points.
- Shipments
- Transfers
Use of O in the selection criteria as single adjustment code will include all the adjustment codes which are rolled up under 'O' in summary. This allows users to review detailed adjustments which appear under the O adjustment type code in the total adjustment code recap on summary version of report - even though they may appear under different adjustment code in the summary version sorted by WARE/ITEM.
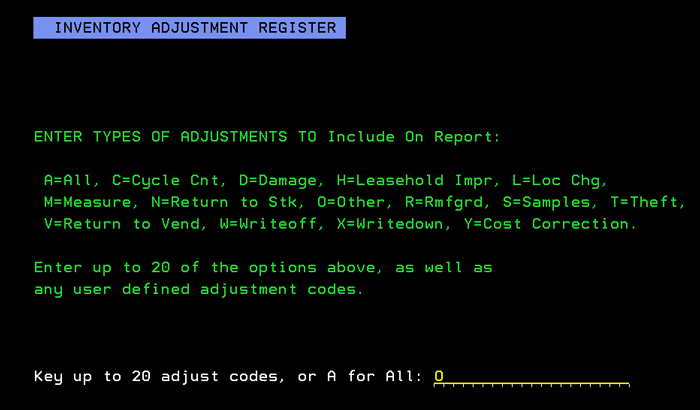
The register generation process takes you through the following steps:
- Selecting the types of adjustments (i.e., cycle count, damage) to include on the report. (Note: When entering the adjustment codes, do not put a space between them.)
- Parameter selections - use these screens to narrow your report selection criteria as needed.
- Selecting to run a detailed or summary version of the report. You can select option 5 to export transfer data to an Excel Spreadsheet. The data on the spreadsheet is arranged by cost center within an accounting period.
In order to see/use the sorting option, you must run the detailed version of the report.
After selecting to run the detailed version of the report, the sorting options appear.
Select a sorting option. For example, you can use sorting options 6 and 7 to determine who made inventory adjustments and the codes they used. Furthermore, when either one of the sorts by user is selected, a recap by user is printed at the end of the report.
Transfers Report - RIV 7
The Transfer Report shows the reason for transfer, user, work station, and time of transactions that have taken place.
Print Negative Inventory List - RIV 8
This report combines all statistics for an item, and all warehouses, into a single global inventory view, and only prints a line if there is a global negative net available.
The first screen to appear lets you run the report for serial numbers or SKU quantities. Select option 1 to list negative SKU File Quantities. Select option 2 to get a list of individual serial numbers with negative quantities.
To report negatives at an item level, you must select option 1.
- The SKU version only lists entire SKU's that are negative. An SKU is an item number at a single warehouse.
- The serial number version lists individual serial number records that are negative. You can also specify to list records with negative available or with negative onhand.
Remember that negative available is a normal occurrence when back orders exceed inventory. However, negative onhand indicates an error or quantities that were invoiced prior to receipt.
The four options for displaying negative inventory are:
|
Report Version |
Description |
|
1 |
Lists any SKUs with a negative onhand or available value. An SKU is defined as an item number plus a warehouse. Therefore, each warehouse is looked at separately. |
|
2 |
Lists any SKUs with negative onhand values. |
|
3 |
Lists any SKUs with a negative Net Available, on a per warehouse basis. Net Available = Onhand - Allocated + Scheduled. Net available is negative when your allocations exceed the total of your onhand and what is on order (scheduled). |
|
4 |
Lists any items with negative Net Available, totalling all warehouses in the selected companies. This version can show globally, any items whose open orders or back orders are not yet covered by purchase orders to fill those customer orders. |
Special and Discontinued Items List - RIV 9
The Special and Discontinued Items List, as accessed via option 9 on the Inventory Reports Menu, lists all discontinued and special inventory as well as applicable policy codes (such as SP = On Special, and DI = To be Discontinued).
Item Reorder and Inventory Forecast Reports - RIV 10
The Item Reorder Report can be run for an established group of warehouses that are referred to as warehouse groups. Warehouse groups can be specified allowing the inclusion or omission of ware-houses from the report. To group warehouses together, enter an existing code in the Enter Warehouse Group Code, for All Warehouses in That Group field. Each warehouse group code represents a set of warehouses. Version 6 includes an option that works well with the warehouse groups concept. This option enables you to specify which of the warehouses included on the report should be considered the distribution center. The distribution center warehouse is usually the warehouse where imports are received prior to shipment to other warehouses.
The field, Growth Factor % enables you to apply a simple global growth factor to your usage figures. For example, if you expect 10% growth over the historical usage averages, then enter 10.00 in this field. If you expect a 10% decline, enter 10.00- . The average usage figure (and average activity figure) will be adjusted by this percentage, up or down. It is recommended that this field be used to adjust for upcoming promotions, seasonality, and other instances where you expect a change the system cannot predict. You can also use this concept after a promotion. For example, if you are basing the forecast on the past three months usage, and there was a promotion during those months, you may want to apply a negative growth factor when the promotion ends.
Reorder Reports as Excel Spreadsheets
The information generated from versions 1, 2, 5, 7, and 8 of the reorder report can be imported into a spreadsheet program. This provides for enhanced data manipulation.
To produce the spreadsheet, enter an X behind the report version number as shown below.
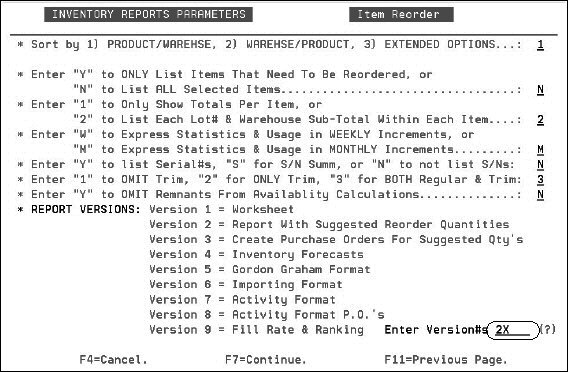
Proceed through the next series of screens that allow you to further limit the report by selecting more parameters, choose the unit of measure, and decide whether or not to use the stocking matrix. After these screens, you will come to the Re-order Reports to Excel screen.
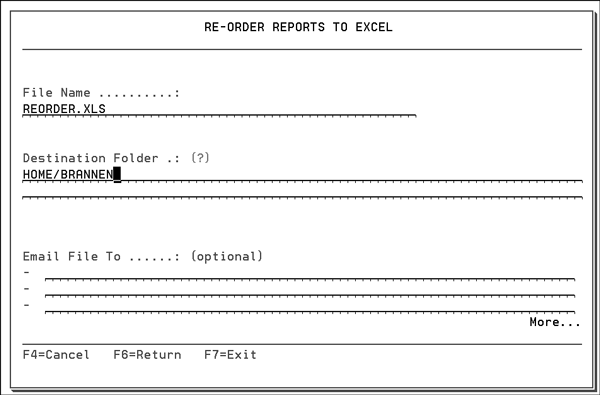
Use this screen to:
- name the spreadsheet, the default name is REORDER.XLS.
- Enter the directory on the IFS drive where the spreadsheet will reside. You can build the directory level by level by entering a ? in the field. The address is built as you drill down. The IFS (integrated file system) is a part of OS/400 that supports stream input/output and storage management, similar to personal computer and UNIX operating systems, while providing an integrated structure over all information stored in the IBM iSERIES.
- Enter email address to send the spreadsheet to.
Version 9
The Item Reorder Report has the ability to automatically create purchase orders for both stock and non-stock items.
Version 9 is both a ranking report, and a fill rate analysis report. The fill rates listed on the report are different than customer fill rates as shown on various sales analysis screens and reports. The fill rate on this report is defined as the percentage of stock items considered in stock. The report allows you to measure your ability to fill orders for your best sellers, sequenced in descending order by sales or order activity. Selecting the new version 9 causes the following parameter screen to display.
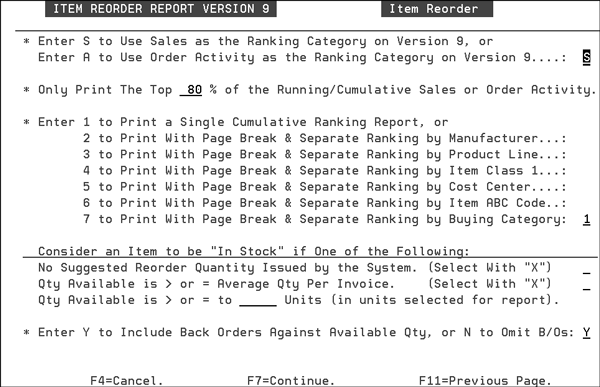
The parameters above control the format of the new Item Reorder Report Version 9, Fill Rate And Ranking. The fields are described below.
|
Parameter |
Description |
|
Enter S to use Sales, or A to use Order Activity as the ranking category. |
Enter S to cause the report to be sorted, highest to lowest, based on sales. Enter A to cause the report to be sorted, highest to lowest, based on order activity. |
|
Only print the Top ___% of the Running/Cumulative Sales or Order Activity. |
Enter a number between 1 and 100 to control through what percentage of cumulative sales or order activity to print. 80% is the default. For example, if you enter 80, only the items representing 80% of cumulative sales or item activity are printed. This leaves off the items comprising the bottom 20%. Usually you are interested in the fill percentage of your top items. |
|
Page Break Options |
If each
of your buyers are represented by a buying category code,
you can use option 7 to
check each buyer's fill percentage.
|
|
Consider an Item to be In Stock if one of the following |
This option determines how the report should consider an item to be in stock or not. Select one of the three options:
|
|
Enter Y to Include Back Orders Against Available Qty, or N to Omit Back orders. |
Enter Y to include back orders in the total allocations. Enter N to omit back orders from total allocations. Only include orders allocated against stock. This option causes your fill percentage to be higher. However, this may give a more fair analysis, as items that have stock that can be sold can be counted as in stock, even though back orders can exist. Sometimes back orders are created, in order to have special shade or dyelots, and not because you are actually out of stock. |
The columns on the Fill Rate And Ranking Report are defined below.
|
Field |
Description |
|
Item# |
Item number |
|
Lot# |
Lot number if applicable. Do not confuse lot numbers with serial numbers. |
|
Description |
Description of the item. |
|
WARE |
Warehouse related to each line on the report. |
|
Manufacturer (or other category) |
This column is a variable depending on the category selected. In the example, Manufacturer was the selected category. |
|
Qty Sold |
The quantity sold in the date span selected. If you select order activity, the order activity appears here instead of quantity sold. |
|
% of Total |
The cumulative (running) percentage of the items printed versus the total for the report. The total of the report is always based on 100% of the selected items, even when only a percentage of the items are requested to be printed. For example, if you only elect to print 80% of the sales volume, the items comprising to 80% are shown in detail, but 100% of the items are included in the totals. |
|
# of Invoices |
The total number of invoices for each item/warehouse in the date span selected. |
|
Avg Qty Per Inv |
Average quantity per invoice=quantity sold divided by number of invoices. |
|
Avg Mthly Qty Sold |
Average Monthly Quantity Sold=quantity sold divided by the number of months shown on the report. |
|
Qty Available |
The current quantity available for each item or warehouse shown. This quantity may or may not include the effect of back orders, based on the parameters selected. |
|
Stock? |
The first character is the inventory field from the Item Master File. Yindicates this is a stock item. N or S means this is a non-stock item. The second character shown is an I, if the item is considered to be in stock, or an O if the item is considered to be out of stock. Items are considered to be in stock or out of stock based on your response to the parameter defining what in stock means. |
|
Stock Items Count |
This is the cumulative (running) number of stock items shown. |
|
In Stock Count |
This is the cumulative (running) number of items considered to be in stock based on the selected formula for determining what in stock is. |
|
Fill Rate % |
Fill Rate %= In Stock Count divided by Stock Items Count. It is the percentage of items which should be in stock, that are actually in stock. |
|
Net Avail Aft Lead Time |
Net Available After Lead Time is the forecasted available quantity, after the lead time, for this item has elapsed. |
|
Suggested Reorder Qty |
This is the suggested quantity to reorder, if any, based on various reorder parameters and formulas. |
|
ABC |
The ABC code from the Item File. |
Item Cost Variance Report - RIV 11
The Cost Variance Reports lists percentage variances between last, average, and standard costs, highlighting or listing only those with large variances.
Print Turn, Earn, & GMROI Analysis Reports - RIV 12
These reports show the turn and earn ratio, and/or the gross margin return on inventory investment ratio for an item.
- Turn and earn equals the quantity turns X G.P.%.
- The GMROI is an industry standard statistical index calculated as follows:
- Gross Profit Amount
- GMROI = X 100
- Average Onhand Inventory Value
Print Inventory Spreadsheets - RIV 13
Inventory spreadsheets enable you to print a listing of stock items, non-stock items, or both.
When option Round to nearest 1000 is selected, the report rounds and omits digits less than 1000. For example, 100,000 prints as 100; 2000 prints as 2; 500 prints as 1; and 499 prints at 0. All totals are calculated prior to rounding. Therefore, ten item values, each of 100, will each show as zero but total to 1.
Print Serial Number Listings - RIV 101
This list shows the shade, status, quantity, and age of each serial number. It also notates remnants (serial numbers with quantity less than or equal to the remnant size defined in the Item Master File for that item) and negative inventory. The serial number list also shows the accumulated back order totals for each item/warehouse as the blank serial number, if any back orders exist. This figure is always shown as a negative availability.
Sorting option 8 - to sort by Freight Class with Total Weight, on the third screen of the report generation process, was designed to move material between warehouses. It directs the report to run by location and print with weight and Hazardous Material notices. It creates a summary version of the report that groups by Freight Class and prints weight and Freight Class description with a grand total by weight in pounds.
Serial Number Inventory Tags - RIV 102
All serialized products can be issued bar coded serial number tags (on labels or laser paper) as they are processed via the receiving programs. A single serial number tag is printed for each receipt line. This usually relates to each pallet, roll or crate for each item received. This label can be used to verify the correct inventory has been picked, staged, cut or shipped. This option prints serial number tags.
List of Temporary Inventory Holds - RIV 103
Displays all orders in a hold status.
Inventory Reconciliation Report - RIV 105
The Inventory Reconciliation Report can be used to completely reconcile perpetual inventory from month to month. Inventory can be reconciled, in units, or dollars for closed months. The report can be detailed, listing each item and warehouse, or summarized on various levels. The report lists the beginning of month balances and a summary of the receipts, adjustments, transfers, and shipments made during the month being reconciled showing calculated versus actual inventory values. This option calculates to the end of month inventory, which is printed along with any variances between the calculated and actual end of month figures.
When this option is selected, you will proceed through the following steps to produce the report.
- Specify the products that should be included on the report and press Enter.
- picking a warehouse and company for which to run the report.
- entering a posting month. You are required to enter a posting month to reconcile. For example, an entry of 0902 reconciles the ending month balance of 8/02, to the ending month balance of 9/902, showing all 9/02 receipts, adjustments, transfers, shipments and variances.
- selecting to reconcile inventory value or inventory units.
- choosing a sort option. There are eight report sorting options ranging from Warehouse/Mfgr/Prodline/Col#/Class/Patt# to Warehouse/Mfgr/Item#.
- selecting a print option. These options are based on the sorting options you selected.
- selecting to print all lines of the report or just those with a variance.
The Inventory Reconciliation Report automatically omits direct shipments (warehouse DIR) unless warehouse DIR is specifically requested. Since warehouse DIR does not represent inventory, it does not need to be included in a complete Inventory Reconciliation. The DIR warehouse can appear to be out of balance, because there is invoicing without receiving, or any inventory onhand balances.
Ability to Export Data to a Spreadsheet
If you use sort option 4 - Detail by Warehouse/Item, The report can be converted to a spreadsheet and sent via email.
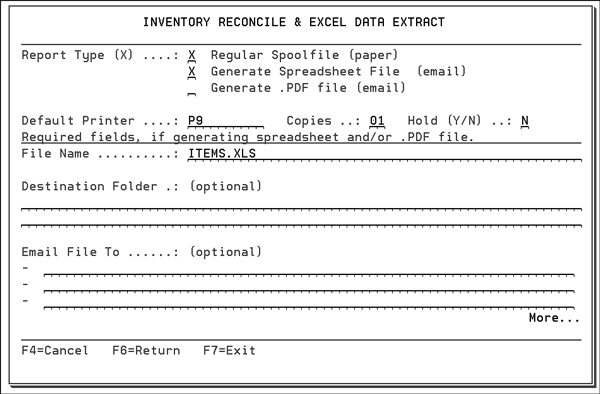
|
Field Name |
Description |
|
Report Type |
Option 1 generates a regular report that gets sent to your spool file where you can print it out as needed. If you choose this option none of the other fields are required. Option 2 sends the information to a spreadsheet program. You can then choose to print it or email it. Option 3 generates the report as a .PDF file. |
|
The following fields are required only if you choose option 2 or 3 to generate a spreadsheet. |
|
|
File Name |
Enter the file name. You should attach the suffix .xls to the file name. |
|
Destination Folder |
This is the IFS directory where you want the spreadsheet to be placed. Once the spreadsheet is generated and sent to this destination you can retrieve it via the Windows Explorer, if you are mapped to the folder. It can also be accessed via WRKLNK command on the IBM iSeries. You cannot use directory /QDLS. If you do not enter a destination folder, you must enter an email address. If no destination folder is entered, a temporary one is created that is automatically deleted when the email is sent. |
|
EMAIL File to |
Enter the email addresses of the person or people (up to three; one per line) you want to receive the report. To access more lines, press the Page Down key. The following guidelines pertain to the email feature:
You can
only enter one Email address per line.
|
Product Line Forecast Report - RIV 106
The Product Line Forecast Report was designed primarily for manufacturers and importers. It can allocate total future production capacity, or container capacity, to the individual items required within the product line based on the percentage of sales that each item represents of the total product line. For example, if only 30,000 pounds of a certain product line can be ordered, or produced, it will list the quantities of each item within that product line to produce or to order, that would total 30,000 pounds.
This report has the following options:
Enter or Maintain Forecasts By Product Line
This option lets you inquire on, or maintain, your existing product line forecasts. You can also use this option to add new records.
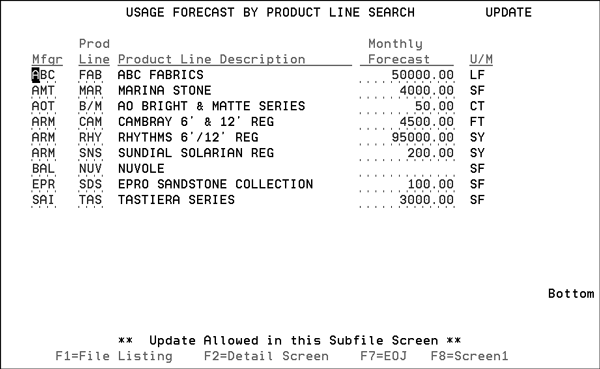
1. When this option is selected, the Product Line Usage Forecast Entry screen appears.
- If you want to update or inquire into an existing forecast, enter the manufacturer and product line codes.
- If you are adding a new forecast, the manufacturer and product line codes have to first be established in the Manufacturer and Product Line files.
2. Press F6 to display an editable listing of all the records on your system.
Run Product Line Forecast Report
This option lets you run a Product Line Forecast Report. The report is broken down by product lines and then by the item within that product line.
1. When this option is selected, the first screen to appear allows you to narrow the report as needed. Use this screen to establish report parameters. For example, you can choose to run the report for a particular manufacturer and product line. If you do not make any entries, the report includes all the product lines on your system.
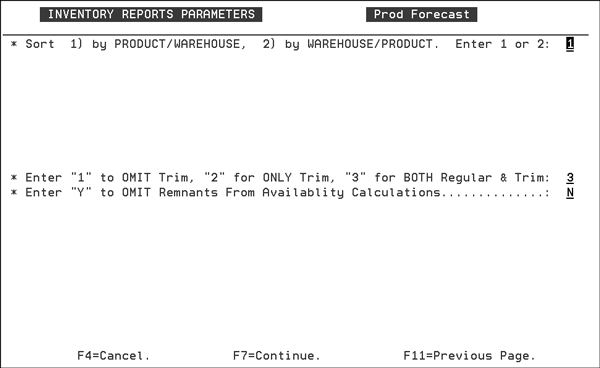
2. Press Enter then F7 to proceed to the next screen.
|
Field |
Description |
|
Sort 1) by PRODUCT/WAREHOUSE, 2) by WAREHOUSE/PRODUCT |
Option 1 sorts the report alphabetically by product line first. The next sorting level is for the warehouses. Option 2 makes Warehouse the first sort, with the product line being the secondary sort. |
|
Enter 1 to OMIT Trim, 2 for ONLY Trim, 3 for BOTH Regular & Trim |
Decide if you want to include trim pieces in the report or run the report strictly for trim pieces. Trim items are designated as such in the Trim Class field of the Item File. |
|
Enter Y to OMIT Remnants From Availability Calculations |
Choose to include or omit remnant pieces in the forecast. Flagging this to N causes the system to only consider and include whole units. |
The information on the report is explained in the following table.
|
Column |
Description |
|
Forecast Entered |
If you have a monthly usage forecast that figure would be displayed here. In this example, no forecast figures have been entered so the message No Forecast Entered displays. You can set product line forecast via option 1- Enter or Maintain Forecasts by Product Line. |
|
Item Number |
Item Number |
|
Lot# |
Lot number if applicable. Do not confuse lot numbers with serial numbers. |
|
Description |
Description of the item. |
|
Warehouse |
The warehouse where this specific item is located. |
|
% of Product Line Sales |
The cumulative (running) percentage of sales for this product line that this particular item accounted for. |
|
Qty Sold |
The quantity of this item that was sold in the specified time frame. |
|
SY Available (or other UM) |
The quantity available after all allocations have been accounted for. |
|
SY on Order |
The amount on order. |
Special Lists Option - RIV 107
The Specials List enables you to create a highly customized list of material you want to sell quickly due to its age or status. The Specials Lists is actually a combination price list and stock availability list. It shares many powerful features of the Price List programs including the ability to price for a specific customer. You can specify parameters that select the stock to display based on item level, SKU level, or serial number level criteria. This criteria can include selection based on remaining quantities, sizes, shades, age, status, and policy. This report can be distributed to salespeople and customer on a regular basis.
1. The following options are available:
- 1 - this option prints specials that are based primarily on item level selection criteria. This option is used to select specials based on item policy codes such as SP and DI.
- 2 -this option prints specials that are based primarily on serial number level selection criteria, although you can also specify item level criteria. This option enables selection based on age, size, quantity remaining, status, and so on.
- 3 - this option adds item level criteria to serial number level criteria. This option is primarily used to combine items with policies, such as SP and DI with aged inventory and other special inventory, based on such criteria as size or status.
2. Enter an option and press Enter. A sample Item Selection Parameter Screen appears. This screen lets you select items by criteria, such as manufacturer or product line. Use the item policy fields to select by policy codes such as SP to indicate special, or DI to indicate discontinued.
3. The next screen appears when you choose serial number level specials or the option for both serial number and non-serial number specials. The fields labeled 1 through 7 limit the serial numbers selected for the specials lists. They are processed in an AND relationship, going down and an OR relationship going across.
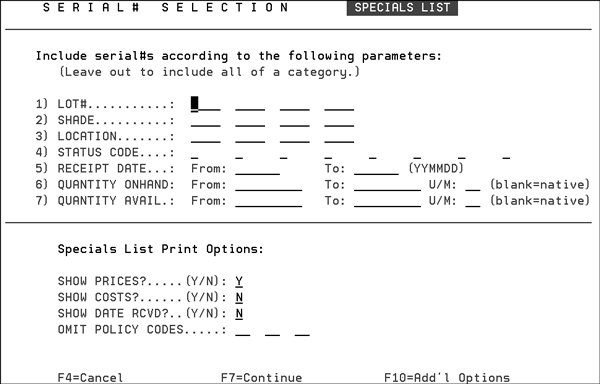
|
Field Name |
Description/Instructions |
|
LOT # |
Do not confuse this field with the serial number or shade/dye lot fields. This field is usually left blank. |
|
SHADE |
Enter up to four shades or leave blank all shades. |
|
LOCATION |
This can be a useful parameter if you have designated locations for certain types of specials. |
|
STATUS CODE |
By using the various inventory adjustment and write-down programs to update the status codes, this can be an effective way to limit specials. |
|
RECEIPT DATE |
Enter a range of receipt dates in order to limit the specials list to serial numbers received before, after, or between specified dates. |
|
QUANTITY ONHAND |
Enter a range of quantities onhand in order to limit the specials list to serial numbers within that range. |
|
QUANTITY AVAIL |
Enter a range of quantities onhand in order to limit the specials list to serial numbers within that available range. |
|
Special List Print Options |
Enter Y or N to show prices, costs, and/or receipt dates on the specials list. You can also specify certain policy codes to omit. If you company is issuing multiple specials list, you can include certain policies (probably SP or DI) on one list, and omit the same policies on another list to avoid duplication. |
4. The series of screens that follow let you customize the report through the following:
- End User Category Selection - Use this screen to optionally include or omit categories via the end user category. This screen is important since end user categories are specifically meant to categorize products according to your customer's requirements.
- Report Sorting Options
- Pricing and price break Information
- Including trim pieces
- Show discontinued items
- Quantity display options
- Warehouse and company selection
- Displaying serial numbers
We recommend that you institute a strategy for the effective use of Special Lists as an aid to reducing aged stock, off lots, overstock and remnants. Following is a simple method of creating a Specials List:
- Mark items with policy SP in one of the Item File policy code fields. This can list all stock for these items on the Specials List.
- Use the Inventory Mass Updates and Write-downs Program to update the Status Code field of certain serial numbers with a special code. You can use S for special, or any character including special characters. This program is used to mark serial numbers based on age, remaining quantity, and other criteria. This method enables you to mark certain serial numbers of items that are otherwise not to be put on special.
- Use the Promotional Pricing File to set special prices based on the policy SP, and the status codes marked on the special serial numbers.
- Run the Specials List using option 3. Include policy SP on the Item Selection Screen, and the special status codes on the Serial Number Selection Screen.
Inventory Reports (Sales and Receipts) - RIV 108
The Inventory Week/Month/Year Reports analyze both shipments and receipts of inventory. This report can be used for buying, as well as for general inventory analysis. Shipments and receipts are shown for past week, month-to-date, and year-to-date. Other columns include onhand, available, allocated, and scheduled quantities. There are many sort options available, but regardless of your sort option, recaps are printed at the end of the report. The report summarizes the figures by cost center, manufacturer, product line, item class 1, and item class 2. The report can list shipments based on quantity (in various units of measure), sales dollars, or gross profits dollars. One unique option in this report is its ability to analyze and sort based on the color name and pattern name fields. The report can analyze pattern within color or color within pattern.
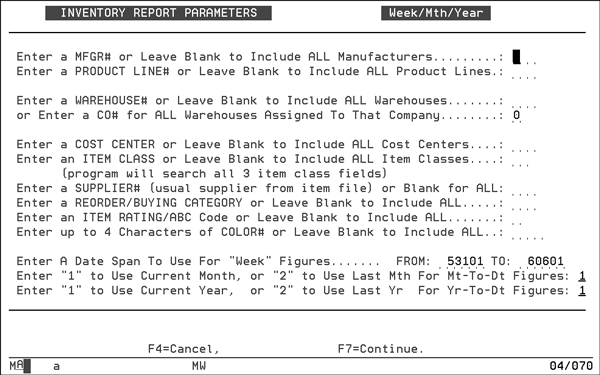
|
Field Name |
Description/Instructions |
|
Enter a MFGR # or Leave Blank to Include ALL Manufacturers |
Enter a manufacturer code to limit the report to a single manufacturer. Leave this field blank to include all manufacturers. |
|
Enter a PRODUCT LINE # or Leave Blank to Include ALL Product Lines |
Enter a product line code to limit the report to a single product line. Leave this field blank to include all product lines. |
|
Enter a WAREHOUSE # or Leave Blank to Include ALL Warehouses |
Enter a warehouse code to limit the report to a single warehouse. Leave this field blank to include all warehouses. Use the Company field to limit to the warehouses with a company. |
|
Or Enter a CO# for ALL Warehouses Assigned to That Company |
Enter a company number to limit the report to warehouses within a specific company. Leave this field blank to include warehouses regardless of company number. |
|
Enter a COST CENTER or Leave Blank to Include ALL Cost Centers |
Enter a cost center code to limit the report to a single cost center. Leave this field blank to include all cost centers. |
|
Enter an ITEM CLASS or Leave Blank to Include ALL Item Classes |
Enter an item class to limit the report that specific item class. Leave this field blank to include all item classes. You should note that the program tests for your item class entry in each of the three Item File item class fields. |
|
Enter a SUPPLIER# (usual supplier from item file) or Blank for ALL |
Enter a supplier code to include only those items with that usual supplier code. Leave this field blank to include items regardless of their usual supplier code. |
|
Enter a REORDERING/BUYING CATEGORY or Leave Blank to Include ALL |
Enter a reorder/buying category to include all items related to that category. Note that the reorder/buying category is assigned within the Product Line file. |
|
Enter an ITEM RATING/ABC Code or Leave Blank to Include ALL |
Enter an item ABC code to limit the report to items with that specific ABC code. Leave this field blank to include items regardless of ABC code. |
|
Enter up to 4 characters or COLOR# or Leave Blank to Include ALL |
Enter the color number, to limit report to only items with that specific color number. The color number is the four characters of the item number that immediately follow the manufacturer code. Leave this field blank to include all color numbers. |
|
Enter A Date Span to Use For Week figures |
This field automatically displays the date span of the past week. However, you can enter any date span in this field, even if it does not represent an actual week. The figures for this date span appear in the weeks column of the report. The definition of the week's span, as entered here, displays in the report heading. |
|
Enter 1 to USE Current Month, or 2 to use Last Mth for Mt-To-Dt Figures |
This option enables you to choose between the current month and the previous month. Your selection controls the figures that appear in the Month column of the report. At the beginning of a new month, you will probably select option 2 to use last month. At the end of the month, you will probably select option 1 for the current month to date. |
|
Enter 1 to USE Current Year, or 2 to use Last Year for Yr-To-Dt |
This option enables you to choose between the current year-to-date and the previous complete year. Your selection controls the figures that appear in the Year column of the report. Enter 1 to include the current year to date. Enter 2 to include last year. |
Press Enter to get the system to accept your input. To navigate to the next screen press F7.
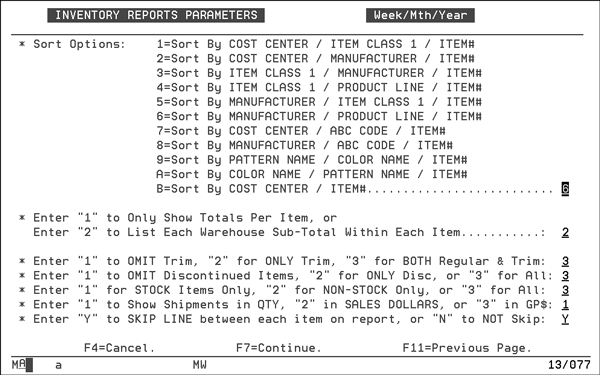
|
Field Name |
Description/Instructions |
|
Sort Options |
Select one of the sort options listed on the screen. |
|
Enter 1 to Only Show Totals Per Item, or Enter 2 to List Each Warehouse Sub-Total Within Each Item. |
Enter 1 to show a single line on the report for each item. It will include the totals of all selected warehouses within the selected items. Enter 2 to show each warehouse's totals within each item followed by totals for the item. |
|
Enter 1 to OMIT trim, 2 for ONLY Trim, 3 for BOTH Regular and Trim |
Enter 1 to omit items with a trim class entry. Enter 2 to include only items with a trim class entry. Enter 3 to include items regardless of their trim class entry. |
|
Enter 1 to OMIT Discontinued Items, 2 for ONLY Disc, or 3 for ALL |
Enter 1 to omit discontinued items. Enter 2 to include only discontinued items. Enter 3 to include all items, whether discontinued or not. For the purpose of this report, an item is considered discontinued if the Item File record contains a date in the Date Discontinued field. |
|
Enter 1 for STOCK Items Only, 2 for NON-STOCK only, or 3 for ALL |
Enter 1 to include only items whose Inventory field entry is Y. Enter 2 to include only items whose Inventory field entry is N or S. Enter 3 to include items regardless of their Inventory field entry. |
|
Enter 1 to Show Shipments in QTY, 2 in SALES DOLLARS, or 3 in GP$ |
The Inventory Week/Month/Year Reports always show receipts expressed in the quantity received. The shipments can be shown in any of these ways. Enter 1 to show shipments as quantity sold. Enter 2 to show shipments as dollars sold. Enter 3 to show shipments as gross profit dollars sold. |
|
Enter Y to SKIP LINE between each item on report or N to NOT skip |
Enter Y to skip one extra line between detail lines on the report for easier reading. Enter N if you choose not to skip the extra line. |
Print Inventory Reorder Exception Reports - RIV 109
The Reorder Exceptions Report enables you to focus on inventory levels that do not comply with the levels and ratios you expect or desire. For example, you can list all items with inventory exceeding twice their optimum stock levels or more.
Print Product By Warehouse By Month Spreadsheets - RIV 110
This option contains a series of different spreadsheets and reports. The first screen to appear is shown below.
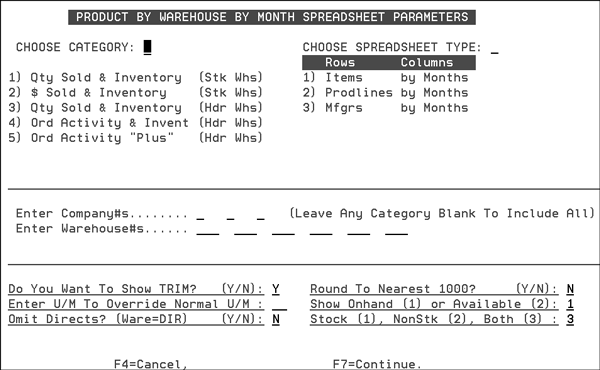
Each category listed on the above screen represents a different report format. The spreadsheet types represent the level of detail shown on the reports. Following is a description of the fields on the above screen.
|
Field Name |
Description/Instructions |
|
Categories |
|
|
Qty Sold & Inventory (Stk Whs) |
This option shows quantity sold for the past 12 months plus current inventory quantities. All statistics are based on the stocking warehouse. |
|
$ Sold & Inventory (Stk Whs) |
This option shows dollars sold for the past 12 months plus current inventory values. All statistics are based on the stocking warehouse. |
|
Qty Sold & Inventory (Hdr Wse) |
This option shows quantity sold for the past 12 months based on the header warehouse, which services the customer. For transfers, this is the destination warehouse. This option also shows quantity of current inventory for the respective warehouses. |
|
Ord Activity & Invent (Hdr Whs) |
This option shows order activity for the past 12 months based on the header warehouse, which services the customer. For transfers, this is the destination warehouse. This option also shows quantity of current inventory for the respective warehouses. |
|
Ord Activity Plus (Hdr Whs) |
This option shows the order activity for the past six months, plus quantity sold for the past six months. Additionally, it shows several other statistics. |
|
Spreadsheet Type |
|
|
Items by Months |
This is a detailed spreadsheet which shows each item and warehouse with subtotals by product line and manufacturer. The subtotals also show a recap by warehouse. |
|
Prodlines by Months |
This is a summary spreadsheet by product line and warehouse, with subtotals by manufacturer. The subtotals also show a recap by warehouse. |
|
Mfgrs by Months |
This is a summary spreadsheet by manufacturer and warehouse. |
|
Enter Company #s |
Select specific company number(s) or leave this field blank for all company number(s). |
|
Enter Warehouse#s |
Select specific warehouse(s) or leave this field blank for all warehouse(s). |
|
Do You Want to Show Trim (Y/N) |
Enter Y to include items with a non-blank trim class code. Enter N to omit items with a non-blank trim class code. |
|
Enter U/M to Override Normal U/M |
Enter a two-character unit of measure code, such as CT, LB, SF or SY, to convert all quantities to that unit of measure. Leave this field blank to print in the native unit of measure. |
|
Omit Directs (Ware=DIR) Y/N |
Enter Y to omit direct ship statistics, which are statistics for warehouse DIR. The program also omits directs if specific warehouses not including DIR are specified. |
|
Round to Nearest 1000? (Y/N) |
Enter Y to round all figures to the nearest 1000 for printing. Note that all additional and totals are done prior to rounding. |
|
Show Onhand (1) or Available (2) |
Enter 1 to show inventory figures based on onhand quantities. Enter 2 to show inventory figures based on quantity available (onhand less allocated). |
|
Stock (1), Nonstk (2), Both (3) |
Enter 1 to include only stock items, 2 to include only non-stock items, or 3 for both. An item is considered non-stock only if the Inventory field in the Item File is N or S. |
Serial Number Summary Reports - RIV 111
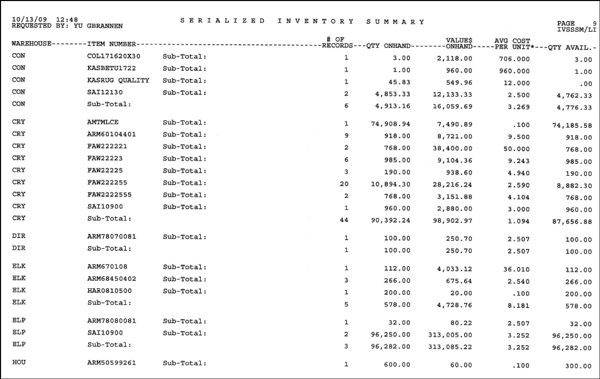
An inventory reports system is available from option 111 of the Inventory Reports Menu. The Serial Number Summary Reports allow you to analyze values and quantities of serialized inventory in several ways. These include:
- Analysis of inventory age, grouped by year, by month, or by day, on a serial number level.
- Analysis of shades and dyelots, within item or other categories, spanning multiple warehouses.
- Analysis of weight, value, quantity, or cubes by bin location.
- Ability to focus on the highest costs and highest values in any category. This can be helpful when researching unexpected increases in inventory value.
- Ability to track inventory cost and valuation by warehouse areas through the inclusion of Area as a selection parameter. If IWMS is being used, the IWMS location is checked first.
- Four level sorting and subtotaling capability.
- The first two screens allow you to select Item and serial number selection parameters. Select from the categories shown, or leave all fields blank to select all items.
- The Serial Number Selection screen allows selections at the serial number level. Each serial number record, which includes serial number and bin location, is tested against the selection criteria. Enter parameters or leave blank to include all serial numbers, and press F7 to display the next parameter screen.
- Select at least one option by entering 1 in the space after it. Select up to four sort options by entering 1-4 next to your choices. Sort option 1 is the main sort, 2 the first sub-sort and the rest fall into similar order.
- Enter your sort options and press F7 to display the next parameter screen.
- Enter a specific warehouse, or a company number, to include all warehouses in a company, or leave both fields blank to include all companies and warehouses. Press Enter. The next screen allows you to omit or include remnants. A remnant is defined as a serialized inventory record with a quantity onhand, equal to or less than, the remnant quantity defined in the item file.
- Make a selection and press Enter. The next screen allows you to convert the quantities shown on the Serial Number Report to a specific common unit of measure. Leave this parameter blank to show all quantities in their native unit of measure.
- Press Enter to progress to the next screen. The Serial Number Summary Report shows value as well as quantity, unless you select option 3 on the Print Costs screen. Select option 1 to display unit costs and value, based on the full landed cost. Select option 2 to display unit costs and values, based on the base portion of cost only (without freight included).
Using the Serial Number Summary Reports for Aging
By selecting the receipt year, receipt month, or receipt date sort fields, the Serial Number Summary Reports can produce an Inventory Aging Report. This is an alternative to the Inventory Aging Reports included in the Inventory Value And Aging Reports Option. These two aging reports are very different, and should be used for different purposes. Consider the following points:
- The Inventory Value And Aging Reports are based on the last receipt date for each product at each warehouse. This is the recommended report to analyze how current the items you have in stock are. Since it is based on the last receipt date, older unsold serial numbers of a recently purchased item are considered as new as the last receipt. The item, including all of its serial numbers, is considered as new or as aged as its last receipt. This version is recommended when showing inventory aging to your bank.
- The inventory aging in the Serial Number Summary Reports are based on the last receipt date for each individual combination of item, warehouse, serial number, and bin location. A single item can have multiple serial numbers, each with its own age. Each serial number, as opposed to each item, is put into its own aging date column. This is a more precise, but perhaps more unforgiving form of aging. In this report, a single old serial number, in an otherwise current item, is shown as aged.
Free Locations Report - RIV 112
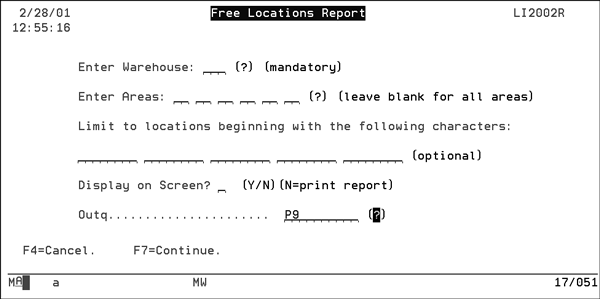
The Free Locations report lists locations that do not have any inventory assigned. Locations can be broken down by warehouse or area.
|
Field |
Description |
|
Enter Warehouse |
Enter the three character warehouse code where you want to conduct the search. An entry here is mandatory. |
|
Enter Areas |
Refines the search to a specific area within the selected warehouse. Up to six search areas can be specified. |
|
Limit Locations... |
To further refine the search, you can enter up to eight characters for five locations inside the warehouse. Only enter as many characters as you want to match by. |
|
Display on Screen? |
You can choose to either display the results on the screen or send the report to a printer. |
|
Outq |
An output destination must be selected if running a report. This field cannot be left blank. To display a listing of all available output destinations enter a ? into the field and press Enter. |
List of Serialized Inventory Without Bin Locations Report - RIV 113
The List of Serialized Inventory Without Locations report identifies inventory that does not have an entry in the Location field.
Item Sales, Price, & Cost Analysis Report - RIV 114
This report provides a convenient method to see the relation between item sales, what you are making off those sales, and what your costs are.
1. When this option is selected, the Item Selection screen appears. Use this screen to choose items to include in the report.
2. Make your selections and press Enter, then F7 to continue to the next screen. This screen presents you with several sorting options and options to narrow the report by warehouse or item type.
3. Enter your options and press Enter then F7 to continue to the next screen.
|
Field |
Description |
|
Enter a PRICE LIST# to use for the prices that will print |
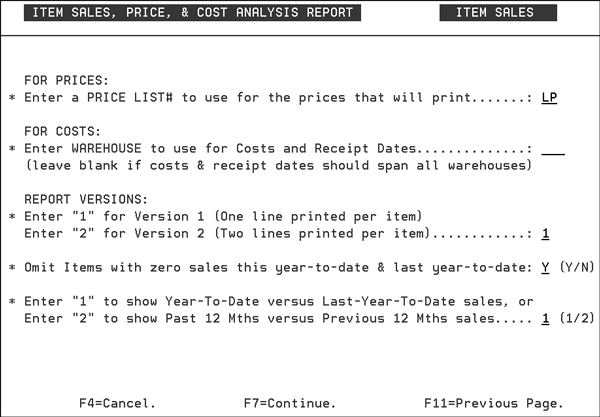
The report uses this price list for pricing information and analysis. |
|
Enter WAREHOUSE to use for Costs and Receipt Dates |
Enter a single warehouse for costing information or leave blank to include all warehouses. |
|
Enter 1 for Version 1 (One line printed per item) Enter 2 for Version 2 (Two lines printed per item). |
Enter a 1 to only have one line printed per item. Enter a 2 to direct the system to print 2 lines per item. |
|
Omit Items with zero sales this year-to-date & last year-to-date |
Enter a Y to omit those items that have not had any sales so far this year or all of last year. |
|
Enter 1 to show Year-To-Date versus Last-Year-To-Date sales, or Enter 2 to show Past 12 Mths versus Previous 12 Mths sales |
Use these options to customize the report to show the information you want to see. You can see either a comparison of year-to-date sales or a comparison of sales based on a 12 month span. |
Serial# Listing for Rolled Goods (RIV 116)
The Serial Number Listing for Rolled Goods is a listing specific to rolled goods. It is based on the existing serial number listing, but has been tailored to include information specific to rolled goods. The list shows the shade, number of cuts, length allocated, length available, and other information for each serial number.
This report includes:
- An expanded version that includes additional information:
- value per serial number
- the receipt date per serial number
- items with units of measure usually associated with rolled goods, such as LF and LY.
- An abridged version that is double spaced for readability and uses additional lines to stack some columns together.
- When this option is selected, the Item Selection screen appears. Enter information as needed to include items. Even if you leave the Item Selection Screen blank, to include all items, the system still limits the report to items that could possibly be rolled goods. These are items with a component code of R or with native units of measure LF or LY.
- Press Enter and then F7 to proceed to the next screen, Serial Number Selection for Rolled Goods. This screen is specific to rolled goods. Leave all the fields blank to include all serial numbers, or make entries to narrow it down as needed.
- Press Enter and then F7 to proceed to the sorting screen. Select one of the sort options, press Enter and then F7 to proceed to the Serial Number Selection screen.
- The Serial Number Selection screen contains several parameter fields that allow you to limit the report as needed. This screen is where you can select to run the regular version or the expanded version which includes: the value per serial number, and the receipt date per serial number.
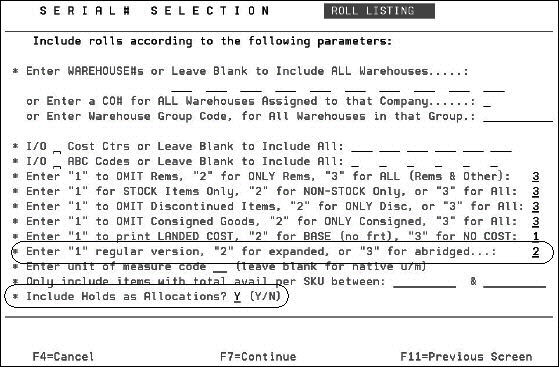
Another option, Include Holds as Allocations, is located at the bottom of the screen. If this option is flagged to Y, then holds are shown as part of the allocated column, and are subtracted from available inventory.
Print Inventory Adjustments Analysis Reports (RIV 117)
This option produces a report for inventory adjustments that can be sorted up to four ways, in summary or detail formats.
Work through the screens, until you get to the Sort Selection screen.
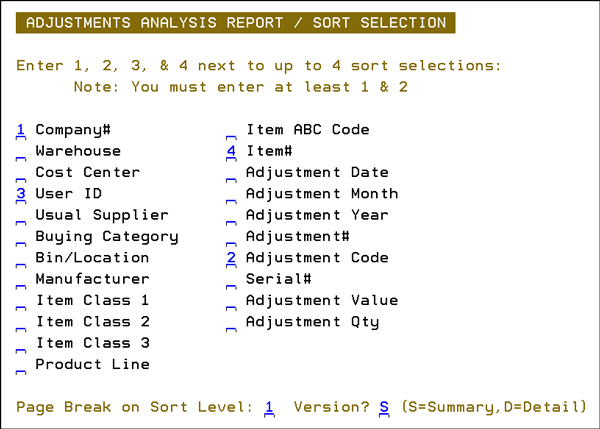
You can enter up to 4 sort options by entering 1 - 4 next to the fields of your choice. Each sort field represents a level of sub-totaling. You must enter at least two selections by entering 1 or 2. Enter only as many as you require.
You can specify where your page break should occur. The default page break is on your primary sort (sort 1).
The detail version of the report contains more fields such as: Adjustment Date, Unit Cost.
Inventory Stock Out Predictor Report (RIV 118)
The report performs either a 12-week or 12-month (depending upon your choice of weekly or monthly usage) inventory forecast. Items that are predicted to be out of stock within the 12 weeks or 12 months are included on the report. The 12 week version is recommended.
The report starts with the current inventory position, including scheduled purchase orders and back orders. The arrival of purchase orders is predicted based on ETA dates, and sales are predicted based upon average sales or activity. A 12 week or 12 month grid is created, showing how much will be available in each week or month. Based on lead times and reorder formulas, the report predicts when new POs will be created
This report can be used to:
- warn purchasers of likely stockouts
- provide list for showrooms and salespeople of items that may soon be out of stock
Running the Report
1. The Inventory Stock Out Predictor report can be accessed from the following menu options:
- Inventory Reports - RIV 118
- Purchasing - PUR 24
- Master Reports - RPT 130
2. The first screen allows you to select the parameters for the report.
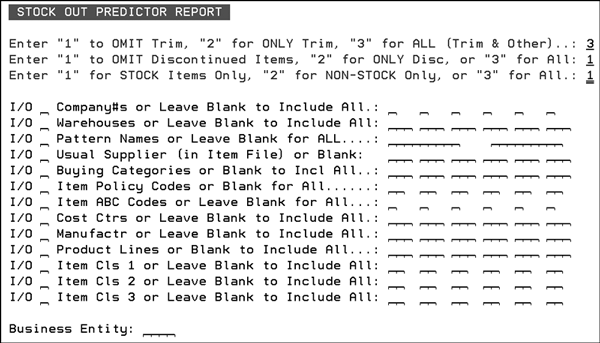
Include or omit parameters as needed.
3. Press Enter and then F7 to continue to the next screen.
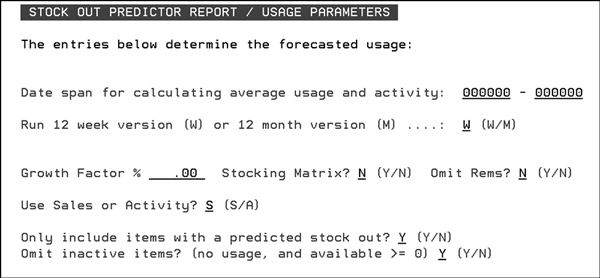
|
Field |
Description |
|
Date span for calculating average usage and activity |
Enter a date span for computing the average usage and activity. This can be whatever date span constitutes the most applicable trends for the products on the report. For most products, selecting the past one to six months can reveal applicable usage figures. The more subject to fashion and other trends an item is, the shorter and more recent the date span should be. For seasonal products, you can select a date span representing the same season last year. For example, if you are forecasting for an upcoming summer season, you can select the date range for last summer. The forecast report will then use last summer's sales and your current inventory position to determine suggested reorder quantities. If you are ordering for an upcoming promotion, you may want to use the time span of the last similar promotion. Leaving the date span blank causes the system to compute usage based on the past year. We recommend that you always enter the applicable date span. This is one of the most important parameters, since it affects the average usage figures. |
|
Run 12 week version (W) or 12 month version (M) |
Enter W to express statistics in weekly increments. Enter M to express statistics in monthly increments. The recommended version is W . |
|
Growth Factor |
This field enables you to apply a simple global growth factor to your usage figures. For example, if you expect 10% growth over the historical usage averages, then enter 10.00. If you expect a 10% decline, enter 10.00-. The average usage figure (and average activity figure) will be adjusted by this percentage, up or down. It is recommended that this field be used to adjust for upcoming promotions, seasonality, and other instances where you expect a change the system cannot predict. You can also use this concept after a promotion. For example, if you are basing the forecast on the past three months usage, and there was a promotion during those months, you may want to apply a negative growth factor when the promotion ends. |
|
Stocking Matrix |
The Stocking Matrix is a set of rules that govern where stock is carried to meet the demands of each geographic grouping of customers. If you do not use the Stocking Matrix File, the system assumes that stock should be replenished to the warehouse where it was stocked. For example, if the stock was picked from warehouse NYC, then without a stocking matrix, the system assumes that stock in NYC should be replenished. If this replenishment method is satisfactory for your operation, or if you have a single stocking warehouse, you do not need to use this file. With a single central stocking warehouse, you should run the reorder reports for all warehouses combined. |
|
Omit Rems |
You can include or omit remnants from the forecast calculations. Remnants are available quantities of a single serial number or lot number that are less than or equal to the remnant quantity/size as entered individually for each item in the Item Master File. This concept only applies to material that usually must be sold from the same or matching serial numbers, lots, or rolls. This parameter is ignored for items that are not stocked by serial or lot number. If you choose to omit remnants, the report ignores the available quantity of any serial or lot number that is less than the remnant quantity in the item master record. For example, let's say the total quantity available = 1000, consisting of three serial numbers of 900, 25, and 75. If the remnant size is 80, then the Stock Out Predictor Report only considers that you have 900 available. |
|
Use Sales or Activity |
Activity is defined as sales plus the change in open order quantities for the selected date span. |
|
Only include items with a predicted stock out? |
Activate this setting to only display those items with a forecasted stock out. |
|
Omit inactive items? (no usage, and available >= 0) |
For an item to be considered inactive it must:
|
The example report shown below, was run to predict item shortages for the first half of the year based on the first six months of the year.
The first item is forecasted to be out of stock on Sept. 12, while the second item is forecasted to be out of stock on Aug. 29.
The parameters shown at the end of the report come from the reorder settings that are used by the reorder reports. These parameters can come from various files, based on how each company uses the purchasing system. The files include:
- Supplier Reorder Parameters File
- Product Line File
- Product Line by Warehouse File
- ABC Code File
- Stock Keeping Units File
The parameters are set in days. which are then converted to weeks or months, and then converted to quantities at the time the report is run.
The report shows 12 weeks of information. In order to be able to display the example so it could be read, weeks 8-12 are not shown.

Inventory Receipts Status Report - RPT 510
This report, accessed through the main Listings and Report menu, can serve as a management tool for Special Order or Non-Stock Inventory, which has been received but not allocated or invoiced. This report is essentially a receipts register, that sorts by Supplier within Manifest/Receipt, and then by line number. The purpose of the report is to identify material that was ordered and received without demand against it. This is especially important for non-stock and special order material, which is generally not purchased except based upon a customer back order. This report may be generated by your accounts payable department prior to vouchering or paying supplier invoices. By catching purchases without demand (as when special orders are cancelled by your customers after you placed the purchase order), you may be able to return material in lieu of payment.
The Value $ Available field should be zero if the receipts were for material that was purchased to fill customer back orders.
