
My RADAR Dashboard
The Dashboard is a set of web pages that can be personalized for each user, with the data they need or prefer. Each web page consists of a series of mini applications revealing Key Performance Indicators (KPIs), sales rankings, sales comparisons, and more.
Settings, General, Page and DIB
Dashboard uses Kerridge Information Bots (DIB) to display information. These DIBs are like customizable dialog boxes common throughout graphical based interface applications and the internet. You can build and save as many as you need. Then you can edit and/or delete them if needed.
When DIBs are added to the right-hand portion of the screen, they are automatically assigned to a "Page". You can have 1 DIB on a page or 100. When you save your work, it is saved as a page and added to the Page tab.
General and Page Settings
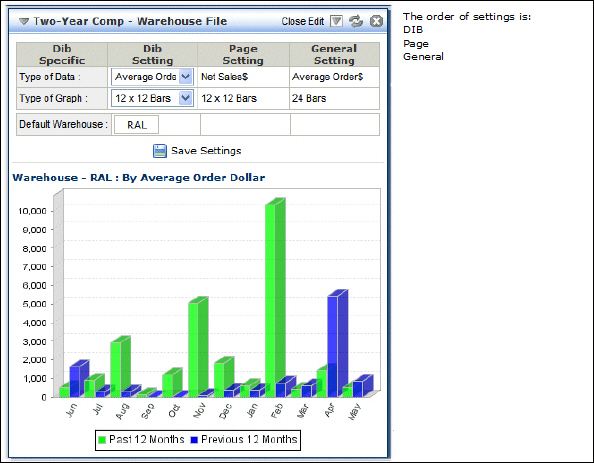
Before you start building DIBs, it's a good idea to set the general and page settings first. These settings act as the defaults, and they can be changed for each individual DIB if needed. The hierarchy of settings is:
- General - Top level; are used if there are no other settings made. These settings apply to all DIBs and pages, unless they are overridden. It is recommended that these settings be used sparingly. Reason being is that often general settings are made and then forgotten which can lead to problems later on.
- Page - Overrides the general settings, but these settings only effect the pages that they are applied to.
- DIB settings - Each DIB can be customized with its individual settings. These settings override both the page and general settings.
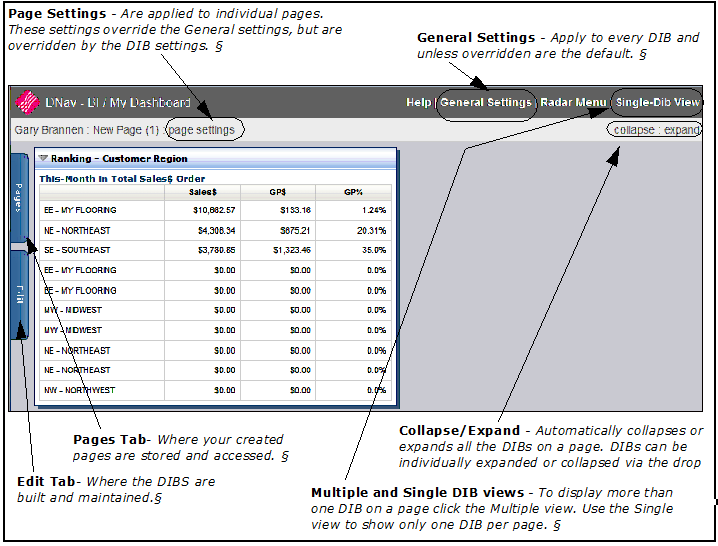
When you first sign on, the My Dashboard screen appears. On the figure below, several key features have been identified and explained.
Settings, General, Page and DIB
The General, Page, and DIB settings are the same, the display may be a little different, but the settings and their options are the same. One thing to notice is that the General settings appear on the Page settings, and both the General and Page settings appear on the DIB settings. This lets you see what the higher level settings are before you override them.
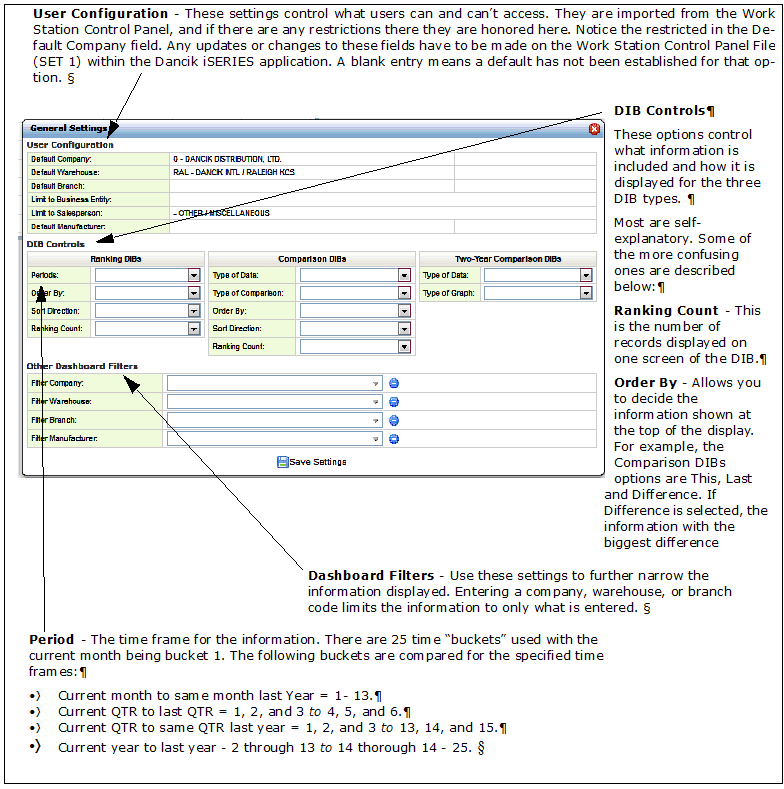
The General settings dialog box is shown below.
Using My Dashboard
Now that we have our settings established, we are ready to build some DIBs and save them as pages.
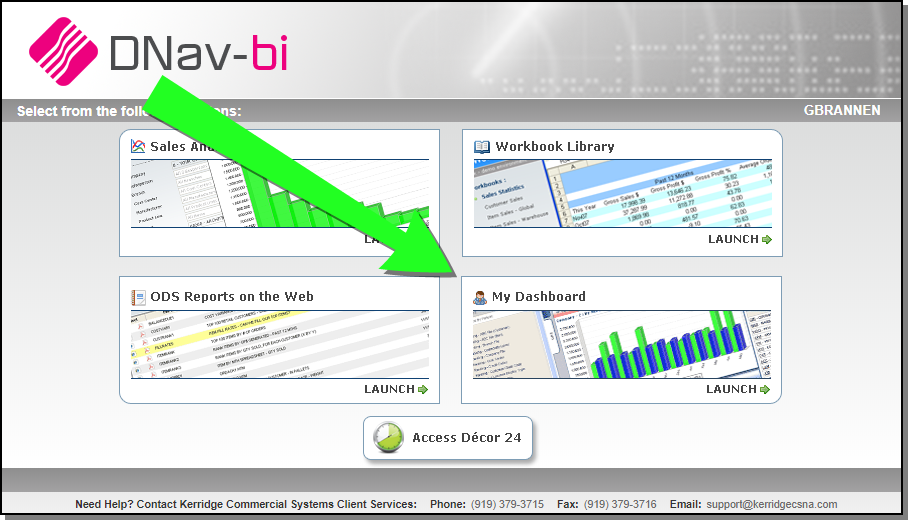
- When you first sign on, the My Dashboard screen appears.
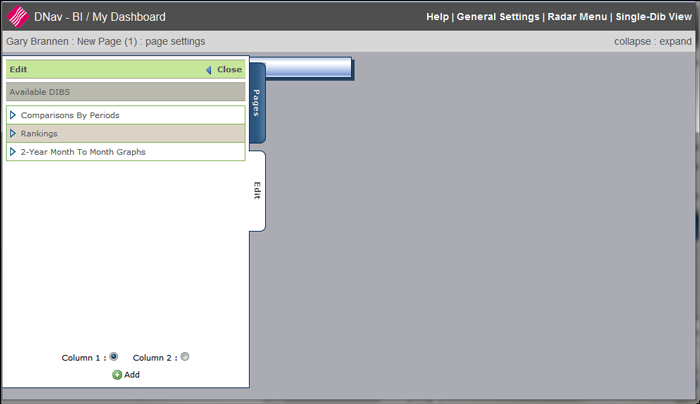
- Comparison by Period - Produces a "time period" comparison for several options. The time period can be set via the general settings, the page settings, or for each DIB. Some of the time frames are: current month to last month (the default), current month to same month last year, quarter to quarter.
- Rankings - Displays "current" month ranking information for the option selected.
- 2-Year Month To Month Graphs - Provides a graphical two year comparison between branches, companies, or warehouses.
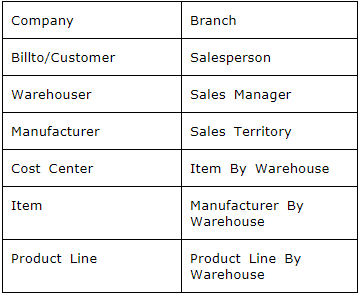
- Click the down arrows to access the options under each DIB.
- Choose an option by clicking it, and then clicking Add at the bottom of the screen.
- Decide if you want the DIBs side by side in a two column format or stacked on top of each other (column 1), and then click Add.
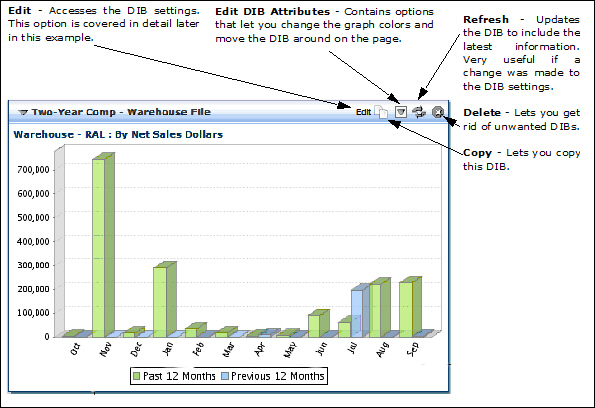
- Each DIB has a header bar that includes the title of the DIB and some other tools.
- To make a DIB more specific and to change its settings away from the General and Page settings, click Edit in the right hand corner of the DIB header. The DIB settings appear.
- Use the DIB settings to only show specific information. In this 2-year comparison of warehouse, the DIB settings were used to customize each DIB to represent a specific warehouse.
- As soon as a page is populated with DIBs, it is automatically saved under the Pages tab. You can change the title of the page by clicking on it and simply entering a new name.
Pages Tab - This is where saved DIBs are accessed. If this is the first time you are signing on and/or using Dashboard, there will not be any pages in here.
The Edit is where the DIBs are built and maintained. Click Edit to display the available DIBs.
In order to display the DIB tools, the cursor must be over the DIB.
Additional Options
The following DIB types can be reformatted as either an HTML file or an Excel spreadsheet.
These DIB types are identified as a link by being underlined
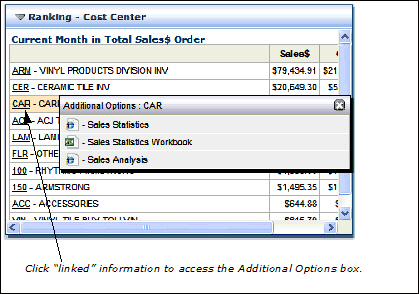
When an additional option is selected, the application (i.e. Sales Analysis) opens up displaying data from the selected link.