Need more info or you couldn't find what you were looking for, let us know by sending an email to: support@dancik.com.
Navigator Inventory Reports
Accessing the Inventory Reports
Inventory Reconciliation Reports
Inventory Value and Aging Reports
Special and Discontinued Items List
Comparative Inventory Analysis
Turn Earn and GMROI Analysis Reports
Accessing the Inventory Reports
There are several ways to access the Navigator Inventory Reports.
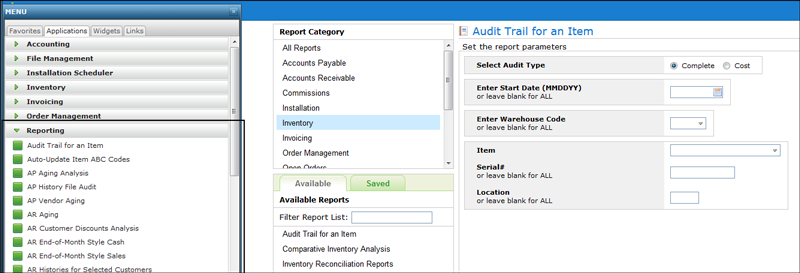
Method 1 - From the Applications Tab on the main Navigator Menu.
Select Reporting under the Applications tab.
This option shows all the available reports for every Navigator application.
Find and select the Inventory report you need.
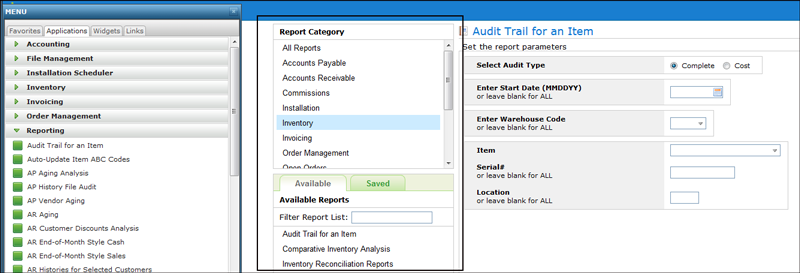
Method 2 - From the Report Category listing
After an initial report is selected using method 1, a Report Category box appears.
Select Inventory and then use the Filter Report List to search for an Inventory report.
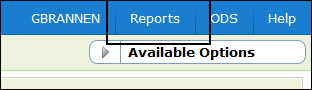
Method 3 - From the Reports heading within the Inventory application
Click Reports in the upper right hand corner of any of the Navigator Inventory windows.
The Audit Trail Report is used to analyze data for a particular item. You can limit the report to a specific starting date or include an item’s complete history. You can also request an audit trail for an item in a specific warehouse or all your warehouses.
Make the following entries:
Select to print a complete audit trail or one just for cost information (only includes receipts and adjustments).
Start date
Warehouse
Enter the item number. If you do not know the item number, use the drop down arrow to access a search box.
Location
Note: If you are a registered user of Dancik’s IWMS and are licensed to use 8-character locations, both the 8-character and the 4-character locations show on an item’s Audit Trail. Eight character locations, used in the IWMS, provide more flexibility in establishing warehouse location schemes.
Inventory Reconciliation Reports
The Inventory Reconciliation Report can be used to completely reconcile perpetual inventory from month to month. Inventory can be reconciled, in units, or dollars for closed months. The report can be detailed, listing each item and warehouse, or summarized on various levels. The report lists the beginning of month balances and a summary of the receipts, adjustments, transfers, and shipments made during the month being reconciled showing calculated versus actual inventory values. This option calculates to the end of month inventory, which is printed along with any variances between the calculated and actual end of month figures.
Note: The report can only be run for months that have been gone through the AR end of period process.
To generate this report:
Specify the parameters to include in the report.
Enter a posting month. You are required to enter a posting month to reconcile. For example, an entry of 0909 reconciles the ending month balance of 8/09, to the ending month balance of 9/09, showing all 9/09 receipts, adjustments, transfers, shipments and variances.
Select to reconcile inventory value or inventory units. Inventory units are based on the native UM designated in the Item File.
Selecting to print all lines of the report or just those with a variance. A variance is produced when entering a supplier invoice (via AP 1) and pressing F12 to reconcile the receipt to an invoice by manifest. If there is a difference between the value of the inventory received and the supplier's bill this is posted to the variance account.
Note: The Inventory Reconciliation Report automatically omits direct shipments (warehouse DIR) unless warehouse DIR is specifically requested. Since warehouse DIR does not represent inventory, it does not need to be included in a complete Inventory Reconciliation. The DIR warehouse can appear to be out of balance, because there is invoicing without receiving, or any inventory onhand balances.
Ability to Export Data to a Spreadsheet
The report can be converted to a spreadsheet or PDF and sent to a file or sent via email.
The following fields are found on the third screen of parameter settings and apply to the distribution features of this report.
Field Name |
Description |
File Name |
Enter the file name. You should attach the suffix .xls to the file name. |
Generate |
|
Hold |
If you place a hold on the report, you can release it later by clicking the options arrow on the Spoolfile Reports option (via the ODS link) and selecting Release. |
Destination Folder |
This is the IFS directory where you want the spreadsheet to be placed. Once the spreadsheet is generated and sent to this destination you can retrieve it via the Windows Explorer, if you are mapped to the folder. It can also be accessed via WRKLNK command on the IBM iSeries. You cannot use directory /QDLS. If you do not enter a destination folder, you must enter an email address. If no destination folder is entered, a temporary one is created that is automatically deleted when the email is sent. |
EMAIL File To |
Enter the email addresses of the person or people you want to receive the report. The following guidelines pertain to the email feature:
Note: You can only enter one email address per line. |
This option lets you print registers for the following transactions:
Receipts - There is an Extended Receipts Register (198 columns). This option is applicable only if you utilize the extended receiving fields. The extended version lists a complete cost breakdown, and also shows the new other Reference Number field.
Adjustments - The Inventory Register displays the user ID for all adjustments. This version enables you to select all adjustment codes, or up to 20 specific codes to show on the report.
Shipments
Transfers
This option arranges the information in a spreadsheet format with information shown horizontally by the parameter Spreadsheet type. There are six spreadsheet formats to select from:
Items by Months
Product lines by Months
Mfgrs by Months
Items by Warehs
Prodlines by Warehs
Mfgrs by Warehs
Note: When the option Round to nearest 1000 is selected, the report rounds and omits digits less than 1000. For example, 100,000 prints as 100; 2000 prints as 2; 500 prints as 1; and 499 prints at 0. All totals are calculated prior to rounding. Therefore, ten item values, each of 100, will each show as zero but total to 1.
Comparative Inventory Analysis
Inventory spreadsheets enable you to print a listing of stock items, non-stock items or both.
This report is similar to the Print Inventory Spreadsheets except that is allows for a comparative analysis over a two year period. The report parameters are the same as for the Inventory Spreadsheet.
The Date Comparison window allows you to select two time periods to analyze.
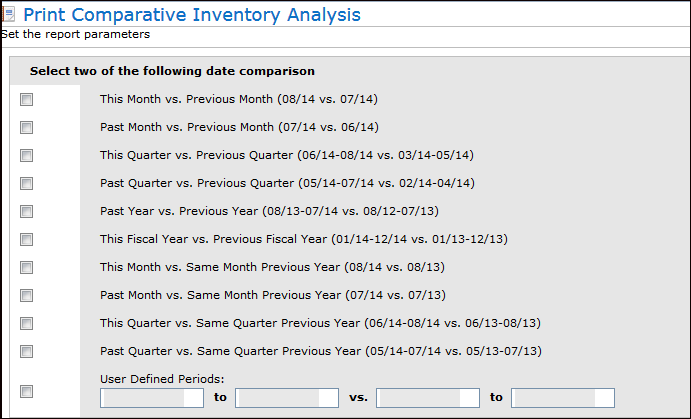
Note: The previous inventory spreadsheet only covered a 12 month period.
Inventory Value and Aging Reports
These reports are based on the last receipt date for each product at each warehouse. This is the recommended report to analyze how current the items you have in stock are. Since it is based on the last receipt date, older unsold serial numbers of a recently purchased item are considered as new as the last receipt. The item, including all of its serial numbers, is considered as new or as aged as its last receipt. This version is recommended when showing inventory aging to your bank.
Parameter |
Description |
Manufacturer |
The manufacturer of the item. If left blank, all manufacturers are included. |
Product Line |
Product lines link the items within a manufacturer into groups that can be researched or queried on. For natural products such as marble and stone, the manufacturer code and product line codes represent groups and categories as opposed to actual brand name product lines. Product lines are created through the File Management Application or through option FIL 12 on the iSeries. |
Item Class 1, 2, and 3 |
A user-defined two-character code for classifying the item. You have up to three Class fields in which to classify the item. Class 1 is the most general of the three item classes. It is also the most important because it is used in the pricing and salesperson assignment programs. Price lists and promotional pricing can be assigned to a customer for specific item Class 1 entries. A customer can also be assigned multiple salespeople based upon Item Class 1. Use Item Class 2 and 3 to further classify items. |
Trim Class |
If the item is a trim piece, enter a code to identify the class of trim piece. Some examples of trim pieces are:
Note: Trim classes are created through the Classification Codes File and are assigned to items via the Item File. |
Item Policy |
Enter an item policy or use the drop down box to select one. Entering an item policy narrows the report to just the items associated with that policy. |
Color Number |
The color number, along with the Manufacturer and Pattern codes, are part of the item number. |
Color Name |
To make searching by color easier, enter the actual color instead of the manufacturer’s designation. For example, if a manufacturer calls an item “snow” that is actually white, the color name should be “white.” If color is not important or applicable to an item, you can use this field for another category such as style, texture, type, or finish. For example, tools can be categorized by type, such as trowel or saw. |
Pattern Number |
Use this field to further limit the report to specific pattern numbers. Pattern numbers are characters 8-16 of an item number. |
Pattern Name |
Enter the pattern name of the item. Pattern names should be standardize to make searching easier. Following are suggested pattern names: Some examples are:
We strongly recommend that you use a consistent system for color and pattern name fields. You can use the item search function to search by color or pattern or both. So, for example, you can find products by entering Blue 4 x 4, White Berber, or Thinset 20LB. |
Price Class |
A price class is a group of items from the same manufacturer that your company prices identically for your customers. |
Cost Class |
A group of items from the same manufacturer that have identical costs from your supplier. |
Package Class |
Packaging classes allow behind the scene calculations between unit of measures. When done correctly, this should create an unbroken chain allowing the system to get from any unit of measure to any other. Note: The Packaging File is used to establish packaging classes. Packaging classes are assigned to items with the Item File. |
Inventory Code |
This setting denotes whether the inventory is stocked, not stocked, or special ordered. Some examples are:
|
Component Code |
The component code denotes whether the inventory is a type such as serial, or rolled goods. Some examples are:
|
Commodity Level |
A one-character code describing an item’s level of relative value. Examples can be H for high-level or luxury items, M for medium-level items, and L for low-value or commodity items. |
ABC Code |
Use this field to select items based on ranking. For example, items can be classified from best (A) to worst (D). Examples of nonranking ABC codes can be:
|
Wear Code |
Industry standard codes should be used when possible, such as 1, 2, or 3. The codes could also indicate whether the product is suited for uses such as residential, commercial, or industrial. |
Cost Center |
This should represent the major divisions of products and services in your company, such as ceramic tile vs. vinyl or. wood. Cost centers are then further subdivided by your item class entries. Cost centers provide a direct interface with the General Ledger system. Note: Cost centers are defined using the Cost Center File Maintenance program. |
Freight Class |
This field classifies items for bills of lading. It is used to scan bar coded labels as shipments are loaded. Data collected at the point of shipment is used to produce bills of lading, when applicable. This field is also used if you download shipping data into an automated truck loading, shipping, or freight system. Freight class codes must first be set up in the Classification Codes File. |
Qty Break Group |
Represents a group of items that are accumulated for quantity breaks on pricing. You can use quantity break group pricing to group products in order to achieve a quantity break based on a combined total quantity instead of each line item quantity. Some examples are:
Note: Quantity break group codes must first be set up in the Classification Codes File. |
String Search |
You can limit the report to specific items (i.e. tile) by performing a string search. A string search looks for the search string within any descriptors of the item. A string search only displays records that contain the string. |
Warehouse Company |
Enter a warehouse and/or company code to limit the report. Leaving these fields blank directs the system to include all warehouses and/or all companies. For example, if the warehouse field is left blank and the Company field has an entry, the report is generated for the warehouses within that company. |
Select Sort |
Select one of the 12 sorting options. The sort option dictates how the information is arranged on the report. |
Select Summary/Detail |
The detail version includes a sub-total for each item series for each warehouse. The columns on the detailed report are:
|
Select Regular/Trim |
Decide if you want to run the report for regular items, trim items, or both. Note: Items are designated as trim pieces through the Item File. |
Select Version |
This option provides seven variations of the report.
— House costs are used when you need to alter a cost for the purpose of sales analysis reporting or sales commissions. For example, on a commodity product that has fluctuating costs, you may prefer to base commissions and reports on a single stable cost. When items are to be sold at great discounts, or even below cost, you can artificially create an acceptable profit margin by entering a low house cost. This could be used for commission, thereby creating an incentive to sell these low or negative margin items. House cost are entered in the Cost File or at the SKU level via the SKU File. — Accounting Costs are used if an additional cost, such as LIFO or FIFO (remove “or FIFO”) cost, is required. The accounting cost can also be entered on an SKU by SKU basis using the SKU File. If you require LIFO costs based upon historical costs, you can store them here.
|
The next screen in the report generation process depends on which report version you choose.
Selecting report versions 1-6 displays the following selection parameter.
|
— Onhand does not consider back orders. It is the current stock available.
— Still Available is the inventory that is available to sell. It equals the quantity onhand minus inventory allocated for customer orders and inventory put on hold.
If you select version 7, the following screen appears.
|
Enter a month to run the report for and two ways to show cost. You must select one of the first two options (either Average Cost At Selected Month End or Last Cost At Selected Month End).
This option lets you customize and run a report showing inventory locations. It provides a snapshot of the locations that house inventory matching your parameter selections. For example, you can run the report to find the locations for trim or floor tile in a specific warehouse.
There are seven listing options that range from Warehouse/Item to Warehouse/MFGR/Pattern Name/Item Number/Location.
Report versions:
Regular - lists item#, name, locations, qty onhand, qty allocated, qty scheduled, last receipt date, & last cycle count date
Expanded - includes all the information of the regular version, but also lists the open orders & purchase orders that could affect your actual onhand qty, such as transfers, orders now being invoiced or with status S, or POs with status R or P.
Complete - includes ALL open orders and purchase orders with their status.
Complete version without purchase orders. - similar to the complete version, except it does not show the open purchase orders for each item. The report still shows all open orders with their correct status.
Data versions
There are four options for formatting the data.
Regular Version - This is the “base” version. It shows: warehouse, item information (with supplier’s item number if applicable), location, and quantity information.
Count Sheet Version - Includes space to enter counted quantities. Quantity information is omitted.
Note: This report should not be used as a replacement for Dancik’s cycle counting features (found in the CYC menu). The CYC menu logically sequences the steps of a cycle count or a complete physical inventory.
Both Versions - Prints both the regular version and Count Sheet version.
Combined Version - This version includes four empty columns where the column heading can be customized to suit your needs. If you want to perform a quick count in a particular area of the warehouse, you could label the columns: Qty, UM, Initials, Date.
Cycle Count options
All of the versions have the following limited cycle counting functionality:
Ability to Assign Ticket#s - A cycle count ticket number is created for each location and unique serial number. Quantities can be entered against these tickets using option CYC 3 - Enter Counts.
Create “Frozen” Cycle Count File - Quantities are frozen at their current value when the file is created. Therefore, all regular system processing of invoices, receipts, and so on can continue while the count is performed and reconciled. New system activity does not affect the frozen file. When the cycle count is posted, the variance posted is the variance between the frozen quantities and the quantities counted. Even when using the frozen file, make sure that your physical count is done prior to starting new physical activity in the locations being counted. As long as you have not physically added or removed material from the locations being counted DURING THE COUNT ITSELF, the frozen file concept accurately records the variances regardless of how long it takes you to reconcile paperwork and post the count.
Preload “Frozen” file with Current Onhand Quantities - This parameter asks if you want to preload the current onhand quantities into the cycle count ticket records. This is like loading the answers before the questions are asked. However, preloading has two advantages:
if users still perform the count honestly and accurately, they will only need to enter quantities that differ from the preloaded quantities.
if anyone should accidently post a count before it is completed, any tickets not actually counted will not record any variances.
This report combines statistics for an item, and all warehouses, into a single “global” inventory view, and only prints a line if there is a global negative net available.
1. The first screen to appear lets you run the report for serial numbers or SKU quantities.
List Negative SKU File Quantities - This version only lists entire SKUs that are negative.
Note: An SKU is an item number at a single warehouse.
List Negative SERIAL# Quantities - Provides a list of individual serial numbers with negative quantities. This version can be useful if you categorize negative inventory in a general ledger suspense account monthly until it is investigated and resolved. You can also specify to list records with negative available or with negative onhand. Remember that negative available is a normal occurrence when back orders exceed inventory. However, negative onhand indicates an error or quantities that were invoiced prior to receipt.
2. After selecting a report version, click next to select the parameters to include in the report.
3. Fill in the parameters as needed and click next to proceed to the next screen. The next screen varies depends on whether you are running the report by SKU quantities or serial numbers.
List Negative SKU File Quantities
|
1. Enter a specific warehouse or all the warehouses in a company
2. Under Listing Options select one of the four options for displaying negative inventory:
Note: Remember that negative available is a normal occurrence when back orders exceed inventory. However, negative onhand indicates an error or quantities that were invoiced prior to receipt.
Option 1 - Lists any SKUs with a negative onhand or available value. An SKU is defined as an item number plus a warehouse. Therefore, each warehouse is looked at separately.
Option 2 - Lists any SKUs with negative onhand values.
Option 3 - This option calculates the negative net available by calculating: Onhand Qty - Allocated + Scheduled. You can use the results of this report to expedite ordering to cover your back orders. This option is only for one warehouse.
Note: Net available is negative when your allocations exceed the total of your onhand and what is on order (scheduled).
Option 4 - This option is essentially the same as option 3 except it pulls information from all warehouses. It lists any items with negative “Net Available”, totalling all warehouses in the selected companies. This version can show globally, any items whose open orders or back orders are not yet covered by purchase orders to fill those customer orders.
3. Decide if you want to display any applicable serial numbers under the items.
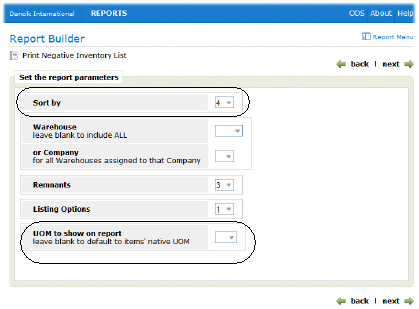
List Negative SERIAL# Quantities
The Sort by and UOM to show on report fields are added.
|
4. Select a sorting option and UOM for the report. If you enter a UOM, the system uses the Packaging File to convert an item’s native UOM to the one specified.
Depending on your parameter selection, this report can show:
the shade, status, quantity, and age of each serial number
Remnants (serial numbers’s with quantity less than or equal to the remnant size defined in the Item Master File for that item)
The accumulated back order totals for each item/warehouse as the “blank” serial number, if any back orders exist. This figure is always shown as a negative availability.
Cost information (only on Management version) either as landed or base cost.
— Landed cost is the total cost of a landed shipment including purchase price, freight, insurance, and other costs up to the port of destination. In some instances, it may also include the customs duties and other taxed levied on the shipment.
— Base cost is the cost minus any freight charges
Special and Discontinued Items List
This report lists all discontinued and special inventory as well as applicable policy codes, such as SP (On Special) and DI (To be Discontinued). The report provides the following information:
How much inventory is available or onhand in each warehouse.
If any discontinued or special items are on order and if so the ETA date and the receiving warehouse.
The Customer version displays the item policy code that caused the item to appear on the report. Item policies are assigned in the Item File. Examples of codes that can cause items to appear on this report are listed below. Each item can be assigned three item polices so there might be more that one listed. In most cases, one of the codes will be SP or DI.
— The Manager version shows cost information (average and last costs).
The discontinue date, if applicable. An item is considered discontinued if the Item File record contains a date in the Date Discontinued field.
The spreadsheet format, sort option 3, provides a quick glance at the discontinued/special inventory by item, subtotaled by manufacturer or by item, for each warehouses or the just the selected warehouses.
The Specials List enables you to create a highly customized list of material you want to sell quickly due to its age or status. The Specials Lists is actually a combination price list and stock availability list. It shares many powerful features of the Price List programs including the ability to price for a specific customer. You can specify parameters that select the stock to display based on item level, SKU level, or serial number level criteria. This criteria can include selection based on remaining quantities, sizes, shades, age, status, and policy. This report can be distributed to salespeople and customer on a regular basis.
We recommend that you institute a strategy for the effective use of Special Lists as an aid to reducing aged stock, off lots, overstock and remnants. Following is a simple method of creating a Specials List:
Mark items with policy SP in one of the Item File policy code fields. This can list all stock for these items on the Specials List.
Use the Inventory Mass Updates and Write-downs Program to update the Status Code field of certain serial numbers with a special code. You can use S for special, or any character including special characters. This program is used to mark serial numbers based on age, remaining quantity, and other criteria. This method enables you to mark certain serial numbers of items that are otherwise not to be put on special.
Use the Promotional Pricing File to set special prices based on the policy SP, and the status codes marked on the special serial numbers.
Run the Specials List using option 3. Include policy SP on the Item Selection Screen, and the special status codes on the Serial Number Selection.
The report can be run for specials based on the following criteria:
1 - this option prints specials that are based primarily on item level selection criteria. This option is used to select specials based on item policy codes such as SP and DI.
2 -this option prints specials that are based primarily on serial number level selection criteria, although you can also specify item level criteria. This option enables selection based on age, size, quantity remaining, status, and so on.
3 - this option adds item level criteria to serial number level criteria. This option is primarily used to combine items with policies, such as SP and DI with aged inventory and other special inventory, based on such criteria as size or status.
You can also run the report by specific criteria, such as manufacturer or product line. Use the item policy fields to select by policy codes such as SP to indicate special, or DI to indicate discontinued.
Quantity Break Pricing
Quantity Break groups allow items with different pricing unit of measures to trigger quantity break pricing discounts. To help explain Quantity Break pricing consider the following items:
Item 1 is sold by QT (quart) and is in quantity break group A1 with a multiplier of 1 (maintained in item master). There is a quantity break discount when 12 QTs are purchased.
Item 2 is sold by GL (gallon) and is also in A1 group also with multiplier of 4. It is has a quantity break price when 2 GLs are purchased.
A customer orders 10 QTs of item 1 and 1 GL of item 2.
The invoicing program groups all lines for the customer with the same quantity break group code and calculates as follows:
Item 1 contributes 10 X 1 = 10 units toward quantity break group A1.
Item 2 contributes 1 X 4 = 4 units toward quantity break group A1.
Total of 14 units are contributed to quantity break group for the purpose of calculating the price each line is eligible for and in this case both lines would receive the quantity break price (because grouped together at 14 each quantity trips the respective discount at 12 and 2 for item 1 and 2 respectively.
Note: Quantity Break pricing is activated in the Company Settings file (SET 3). The actual Quantity Break groups are created in the Classification Codes File (FIL 19).
Running the Report for Serial Numbers (Options 2 and 3 in the Specials parameter)
When you choose serial number level specials or the option for both serial number and non-serial number specials. A set of parameters appears that allow you to limit the serial numbers selected for the specials lists. They are processed in an “AND” relationship, going down and an “OR” relationship going across. The parameters on this screen provide the following functionality:
Special List Print Options - Choose to show prices, costs, and/or receipt dates on the specials list. You can also specify certain policy codes to omit. If your company is issuing multiple specials list, you can include certain policies (probably SP or DI) on one list, and omit the same policies on another list to avoid duplication.
Enter a range of quantities onhand in order to limit the specials list to serial numbers within the onhand or available range.
Note: The Serial Number Selection screen does not appear if you choose option 1.
Field Name |
Description/Instructions |
LOT # |
Do not confuse this field with the serial number or shade/dye lot fields. This field is usually left blank. |
SHADE |
Enter up to four shades or leave blank all shades. |
LOCATION |
This can be a useful parameter if you have designated locations for certain types of specials. |
STATUS CODE |
By using the various inventory adjustment and write-down programs to update the status codes, this can be an effective way to limit specials. |
RECEIPT DATE |
Enter a range of receipt dates in order to limit the specials list to serial numbers received before, after, or between specified dates. |
Running the Report at the Item Level (Option 1 in the Specials parameter)
|
End User Categories are important since end user categories are specifically meant to categorize products according to your customer's requirements.
The Stock Activity report includes item number, item description, quantity on hand, stock allocated, current stock available, scheduled, back orders, future available, quantity shipped, and number invoices.
The Stock Activity Report includes the following information about each item or item/warehouse record:
monthly totals of receipts, shipments, and number of orders placed.
Open orders shown in total, and within each of the months that they were placed.
Turns and GMROI based upon the past 12 months.
Stock Onhand and Stock Available. Stock Available does not consider back orders. It is the current stock available.
Scheduled purchase orders.
Future Available = scheduled less back orders. This is similar to the “F” stock card view on Inventory Inquiry.
The first screen in this report process is shown below.
|
Parameter |
Description |
Stock Activity Reports |
Choose to run the report for a date span or for the last 18 months. Selecting the 18 month option presents more report parameters a little further into the process. Some of these parameters are:
|
Date Span |
You can use one or both of these fields to limit the report to a specific time frame. If you enter a “from” date but no “to” date the report is run from the from date to the present. |
Manufacturer Code |
The manufacturer of the item. If left blank, all manufacturers are included. |
Product Line |
Product lines link the items within a manufacturer into groups that can be researched or queried on. For natural products such as marble and stone, the manufacturer code and product line codes represent groups and categories as opposed to actual brand name product lines. Product lines are created through the File Management Application or through option FIL 12 on the iSeries. |
Warehouse Code or Company Code or Warehouse Group Code |
If you enter a single warehouse code the report is limited to that warehouse. If you enter a company code, the report is run for all warehouses in that company. Warehouse groups are established groups of warehouses that allow you to include or omit warehouses from the report. Groups can be created by geography, size, or various or parameters. Note: Warehouse groups are created and maintained through the Warehouse Group Code, for All Warehouses in that Group field in the Purchasing Reorder Reports (PUR 5). |
Cost Center |
Cost centers should represent the major divisions of products and services in your company, such as ceramic tile vs. vinyl or. wood. Cost centers are then further subdivided by your item class entries. Cost centers can provide a direct interface with the General Ledger system. Note: Cost centers are defined using the Cost Center File Maintenance program |
Item Class |
Every item can be assigned three item classes in the Item File. Item classes are user-defined two-character codes for classifying the item.Class 1 is the most general of the three item classes. Some examples are VT for vinyl tile and WD for wood. Use Item Class 2 and 3 to further classify items. If an item class is entered, all three item classes are searched. Therefore if your item class 1, 2, and 3 codes are all unique, this parameter can access any item class. |
Supplier Code |
You can narrow the report to one supplier by entering a code into this field or you can run the report for all suppliers by leaving it blank. The report searches for and displays the supplier entered in the Usual Supplier# field in the Item File. |
Reorder/Buying Category |
These three-character code represents the buyer or the buying category. They are used to group products for reporting. Note: These codes must be set up in the Classification Codes File - FIL 19 via the RC category. Note: Items are assigned to reorder/buying categories by Product Line. |
Item Rating/ABC Code |
Use this field to select items based on ranking. For example, items can be classified from best (A) to worst (D). Examples of nonranking ABC codes can be:
|
Color Number |
The color number, along with the Manufacturer and Pattern codes, are part of the item number. The color number is the four characters of the item number that immediately follow the manufacturer code. Enter up to four characters of the color number to limit the report to that particular color number. Optionally, you can leave this field blank to include all color numbers. |
After making the necessary entries, click next to proceed to the next screen.
|
Parameter |
Description |
Sort By |
Select from one of nine sorting options. Each of the sorting variations is useful for different versions of the report. For example, option 3 - to sort Stock Activity by Supplier Item facilitates more effective consignment inventory reporting to your suppliers. |
Trim |
Items are designated as trim pieces through the Trim Class field in the Item File.
|
Stock |
The Inventory field in the Item File designates whether an item is a stock or non-stock item.
|
The next screens that appear depend on the time frame you selected to run the report for.
18 Month Spreadsheet
If you ran it as an 18 month spreadsheet, the additional options appear.
|
Parameters |
Description |
Print Quantities |
Select a UOM to display the item quantities in. If the UOM entered is different from the native UOM, as specified in the Item File, the system uses the Packaging File to make the necessary UOM conversions. |
Suppress Zeros |
Use this option to drop zeros from the report and make it easier to read. This report includes a lot of information on each page, and you may find it easier to see the meaningful figures if the zeros are not shown. |
Pattern Numbers |
Use this field to further limit the report to specific pattern numbers. Pattern numbers are characters 8-16 of an item number. |
Limit to Items with at least this many orders In the past number of months |
These fields allows you to target faster moving inventory and eliminate clutter on the report by not showing slow moving inventory. |
Omit up to three Warehouses |
This option is only shown if the option to include all warehouses (or all warehouses within a company) was selected. |
Include/Omit ABC Codes |
Use this field to limit the report to specific ABC codes. |
Include/Omit Cost Centers |
Use this field to limit the report to specific cost centers. |
Discontinued Items |
Choose to include or exclude discounted items. For the purpose of this report, an item is considered discontinued if the Item File record contains a date in the Date Discontinued field or has a policy code of DI. |
Print Last Cost Print List Price Print Turns/GMROI |
To print the most landed current cost, activate Print Last Cost. To print the current list price activate the Print List Price field. The third option, if activated, shows the turn and earn ratio and the gross margin return on inventory investment (GMROI) ratio for an item. Inventory turns are based on dollar value followed by inventory turns based upon quantity. The inventory turns are calculated as follows:
The GMROI is an industry standard statistical index calculated as follows:
|
For rolled goods, list available quantity as less than versus greater than or equal to the entered amount. |
Identify rolled goods inventory that is either over/equal to or under a specified amount. If an entry is made in this field (i.e. 50 LF), the report separates the inventory into two groups: less than or greater than the entered amount. |
Date Span Option
This option presents new parameters.
Report Version - Select one of the three report versions.
— Report Summary - combines sales figures with a breakdown of current versus future inventory availability, resulting in a very clear and simple inventory analysis report.
— Detailed Report - shows unit cost and value shipped as a tool for reporting on consignment stock. You can choose to express the shipped value using last cost, average cost, or base cost. By using base cost you can report to your supplier without the affect of freight cost. This is important if the supplier did not cover the freight costs.
— Detailed 198 Column Report - This report contains even more information than the detailed version. To print in a 198 column format you have to have a wide carriage printer. If you are unsure if your system is configured to run a 198 column format report, try a test page. If you experience problems (i.e., unreadable data, report doesn’t print at all), try one of the other report versions.
This report tells you how much inventory you have and where it is for all or one of your warehouses and item numbers.
This report includes the following information about each item or item/warehouse record:
monthly totals of receipts, shipments, and number of orders placed.
Open orders shown in total, and within each of the months that they were placed.
Turns and GMROI.
Stock Onhand and Stock Available. Stock Available does not consider back orders. It is the current stock available.
Scheduled purchase orders.
Future Available = scheduled less back orders. This is similar to the “F” stock card view on Inventory Inquiry.
The parameters available on this report are described in the following table.
Parameter |
Description |
Manufacturer |
The manufacturer of the item. If left blank, all manufacturers are included. |
Product Line |
Product lines link the items within a manufacturer into groups that can be researched or queried on. For natural products such as marble and stone, the manufacturer code and product line codes represent groups and categories as opposed to actual brand name product lines. Product lines are created through the File Management Application or through option FIL 12 on the iSeries. |
Item Class 1, 2, and 3 |
A user-defined two-character code for classifying the item. You have up to three Class fields in which to classify the item. Class 1 is the most general of the three item classes. It is also the most important because it is used in the pricing and salesperson assignment programs. Price lists and promotional pricing can be assigned to a customer for specific item Class 1 entries. A customer can also be assigned multiple salespeople based upon Item Class 1. Use Item Class 2 and 3 to further classify items. |
Trim Class |
If the item is a trim piece, enter a code to identify the class of trim piece. Some examples of trim pieces are:
Note: Trim classes are created through the Classification Codes File and are assigned to items via the Item File. |
Item Policy |
Enter an item policy or use the drop down box to select one. Entering an item policy narrow the report to just the items associated with that policy. Leave these fields blank to include all item policies. |
Color Number |
The color number, along with the Manufacturer and Pattern codes, are part of the item number. |
Color Name |
To make searching by color easier, enter the actual color instead of the manufacturer’s designation. For example, if a manufacturer calls an item “snow” that is actually white, the color name should be “white.” If color is not important or applicable to an item, you can use this field for another category such as style, texture, type, or finish. For example, tools can be categorized by type, such as trowel or saw. |
Pattern Name |
Enter the pattern name of the item. Pattern names should be standardize to make searching easier. Following are suggested pattern names: Some examples are:
We strongly recommend that you use a consistent system for color and pattern name fields. You can use the item search function to search by color or pattern or both. So, for example, you can find products by entering Blue 4 x 4, White Berber, or Thinset 20LB. |
Price Class |
A price class is a group of items from the same manufacturer that your company prices identically for your customers. |
Cost Class |
A group of items from the same manufacturer that have identical costs from your supplier. |
Package Class |
Packaging classes allow behind the scene calculations between unit of measures. When done correctly, this should create an unbroken chain allowing the system to get from any unit of measure to any other. Note: The Packaging File is used to establish packaging classes. Packaging classes are assigned to items with the Item File. |
Inventory Code |
This setting denotes whether the inventory is stocked, not stocked, or special ordered. Some examples are:
|
Component Code |
The component code denotes whether the inventory is a type such as serial, or rolled goods. Some examples are:
|
Commodity Level |
A one-character code describing an item’s level of relative value. Examples can be H for high-level or luxury items, M for medium-level items, and L for low-value or commodity items. |
ABC Code |
Use this field to select items based on ranking. For example, items can be classified from best (A) to worst (D). Examples of nonranking ABC codes can be:
|
Wear Code |
Industry standard codes should be used when possible, such as 1, 2, or 3. The codes could also indicate whether the product is suited for uses such as residential, commercial, or industrial. |
Cost Center |
This should represent the major divisions of products and services in your company, such as ceramic tile vs. vinyl or. wood. Cost centers are then further subdivided by your item class entries. Cost centers provide a direct interface with the General Ledger system. Note: Cost centers are defined using the Cost Center File Maintenance program. |
Freight Class |
This field classifies items for bills of lading. It is used to scan bar coded labels as shipments are loaded. Data collected at the point of shipment is used to produce bills of lading, when applicable. This field is also used if you download shipping data into an automated truck loading, shipping, or freight system. Note: Freight class codes must first be set up in the Classification Codes File. |
Qty Break Group |
Represents a group of items that are accumulated for quantity breaks on pricing. You can use quantity break group pricing to group products in order to achieve a quantity break based on a combined total quantity instead of each line item quantity. Some examples are:
Note: Quantity break group codes must first be set up in the Classification Codes File. |
String Search |
You can limit the report to specific items (i.e. tile) by performing a string search. A string search looks for the search string within any descriptors of the item. A string search only displays records that contain the string. |
Select Sort |
Choose one of the three sorting options. |
Select Quantity |
Use this field to narrow the results to a specific quantity. |
Warehouse Company |
Enter a warehouse and/or company code to limit the report. Leaving these fields blank directs the system to include all warehouses and/or all companies. For example, if the warehouse field is left blank and the Company field has an entry, the report is generated for the warehouses within that company. |
Omit Records |
Activate this option if you do not want to include items with no inventory available or scheduled for receipt. |
List Sub Totals for |
Enter 1 to sum inventory records for each item by warehouse. Enter 2 to also include lot# to item totals by warehouse. A lot# column is added to the report. The Lot# field is used in Order Entry to order special/non-stock items. Option 2 can be used to organize the report so special order items can be easily reviewed. |
List Serial Numbers |
Includes the item serial numbers. Used primarily for rolled goods. |
Select Regular/Trim |
Decide if you want to run the report for regular items, trim items, or both. Note: Items are designated as trim pieces through the Item File. |
U/M |
Choose the Unit of Measure from the drop down box or type one directly into the box. |
Report Version |
Negative quantity is calculated as Onhand Qty - Allocated + Scheduled. |
Discontinued Items |
For the purpose of this report, an item is considered discontinued if the Item File record contains a date in the Date Discontinued field or has a policy code of DI. |
This report provides the following information about your transfers.
To and From warehouse
Item information to include description, serial number, and lot number
Quantity transferred
Date Information: Transaction Date, Ship Date, and ETA Date
Value of the transfer and any additional freight charges
If the report is run for more than one warehouse, the transfer quantity and value is totaled for each warehouse.
Note: When a transfer is received or modified (i.e., an adjustment is made), a reference number is automatically generated.
Turn, Earn, and GMROI Analysis Reports
These reports show the turn and earn ratio, and/or the gross margin return on inventory investment ratio for an item, product line, manufacturer, or warehouse.
Turn and earn equals the quantity turns x G.P.%.
The GMROI is an industry standard statistical index calculated as follows:
![]()
The first screen allows you to select what you want to run the report for. The parameter selection screens that follow depend on the option you select on the first screen.
Most of the parameter selections are self-explanatory. The more complicated ones are described below with the report option they pertain to.
Include or omit the parameters (only on report option 1 - Items) - Use this option to run the report only for the parameters you specify. If you choose to omit, the report runs for all except the entered parameters.
Select Report Time Period: (on all report options: items, product line, manufacturers and warehouses)
— Past 12 months - Information is based on the 12 months prior to the current month. If today is 05 Feb. 2010, this date span would include 05 Feb. 2009 to 05 Feb. 2010.
— Previous 12 months - This information is from the 12 months prior to the past 12 months. The data is based on the end of the month 24 months ago. If today is 05 Feb. 2010, this date span would include 05 Feb. 2008 to 05 Feb. 2009.
Product Lines considered as consignment only: (on options 1 and 2) Consignment items are identified in the Product Line File. These are items that you don’t own, but are selling for a manufacturer or supplier.